319 S Main St SE Blomkest, MN 56216
Estimated Value: $108,017 - $297,000
--
Bed
--
Bath
868
Sq Ft
$212/Sq Ft
Est. Value
About This Home
This home is located at 319 S Main St SE, Blomkest, MN 56216 and is currently estimated at $184,006, approximately $211 per square foot. 319 S Main St SE is a home with nearby schools including Lakeland Elementary School, Willmar Middle School, and Willmar Senior High School.
Ownership History
Date
Name
Owned For
Owner Type
Purchase Details
Closed on
Feb 13, 2009
Sold by
Porter Cindy and Porter Don
Bought by
Brink Diane Carol
Current Estimated Value
Home Financials for this Owner
Home Financials are based on the most recent Mortgage that was taken out on this home.
Original Mortgage
$40,500
Outstanding Balance
$25,546
Interest Rate
5.06%
Mortgage Type
New Conventional
Estimated Equity
$158,460
Purchase Details
Closed on
Feb 5, 2009
Sold by
Trebtoska Ladonna
Bought by
Brink Diane C and Brink Diane Carol
Home Financials for this Owner
Home Financials are based on the most recent Mortgage that was taken out on this home.
Original Mortgage
$40,500
Outstanding Balance
$25,546
Interest Rate
5.06%
Mortgage Type
New Conventional
Estimated Equity
$158,460
Purchase Details
Closed on
Dec 29, 2008
Sold by
Brink Diane C
Bought by
Brink Diane Carol
Home Financials for this Owner
Home Financials are based on the most recent Mortgage that was taken out on this home.
Original Mortgage
$40,500
Outstanding Balance
$25,546
Interest Rate
5.06%
Mortgage Type
New Conventional
Estimated Equity
$158,460
Purchase Details
Closed on
Mar 27, 2007
Sold by
Brink Laverne G and Brink Luverne G
Bought by
Trebtoske Michaela Jean
Create a Home Valuation Report for This Property
The Home Valuation Report is an in-depth analysis detailing your home's value as well as a comparison with similar homes in the area
Home Values in the Area
Average Home Value in this Area
Purchase History
| Date | Buyer | Sale Price | Title Company |
|---|---|---|---|
| Brink Diane Carol | $27,000 | Rels Title | |
| Brink Diane C | $9,000 | Rels Title | |
| Brink Diane Carol | -- | None Available | |
| Trebtoske Michaela Jean | -- | None Available | |
| Trebtoske Michaela Jean | -- | None Available |
Source: Public Records
Mortgage History
| Date | Status | Borrower | Loan Amount |
|---|---|---|---|
| Open | Brink Diane C | $40,500 |
Source: Public Records
Tax History Compared to Growth
Tax History
| Year | Tax Paid | Tax Assessment Tax Assessment Total Assessment is a certain percentage of the fair market value that is determined by local assessors to be the total taxable value of land and additions on the property. | Land | Improvement |
|---|---|---|---|---|
| 2025 | $988 | $86,000 | $6,300 | $79,700 |
| 2024 | $824 | $86,800 | $6,300 | $80,500 |
| 2023 | $710 | $73,600 | $6,300 | $67,300 |
| 2022 | $718 | $68,500 | $6,300 | $62,200 |
| 2021 | $710 | $59,800 | $4,900 | $54,900 |
| 2020 | $700 | $57,300 | $4,900 | $52,400 |
| 2019 | $662 | $57,200 | $4,900 | $52,300 |
| 2018 | $1,788 | $55,400 | $4,900 | $50,500 |
| 2017 | $1,840 | $55,800 | $4,900 | $50,900 |
| 2016 | $2,046 | $335 | $0 | $0 |
| 2015 | -- | $0 | $0 | $0 |
| 2014 | -- | $0 | $0 | $0 |
Source: Public Records
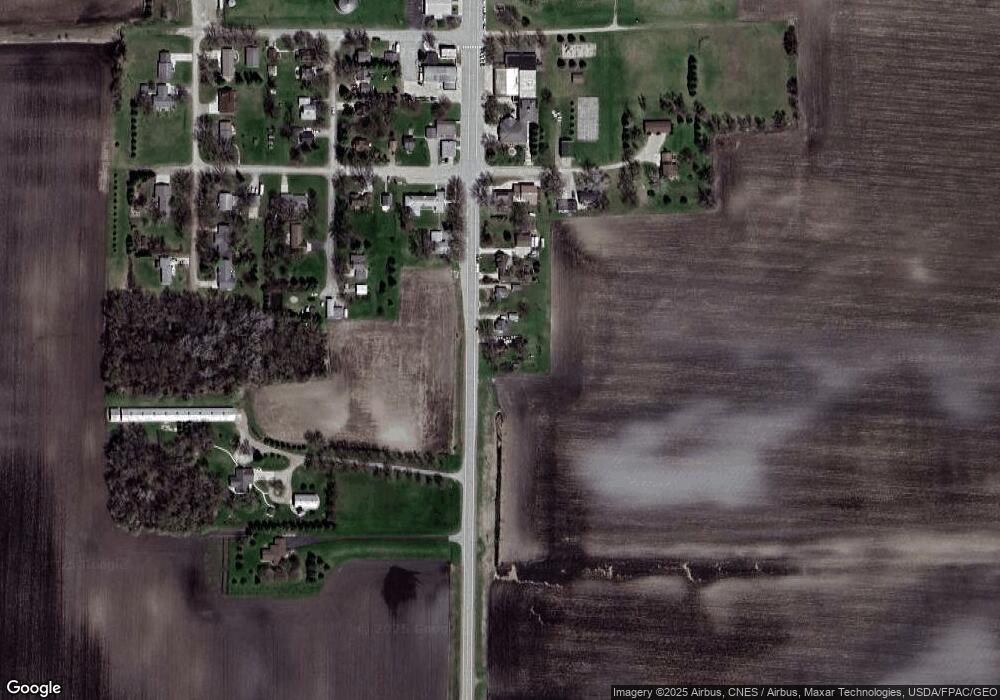
Map
Nearby Homes
- 34701 Route 7
- 418 210th Ave SE
- 18831 46th St SW
- 1675 127th Ave SE
- 330 1st St W
- 680 1st St E
- 33796 County Road 11
- 307 Roseland Ave Unit 5
- 16121 County Road 4 SE
- 8181 79th St SE
- 6854 58th Ave SE
- Lot 4 Abbott Dr
- Lot 5 Abbott Dr
- #### County Road 5 SW
- 3120 15th St SW
- 302 3rd St
- 507 Oak St
- 2610 9th St SW
- XXX 30th Ave SW
- TBD 30th Ave SW
- 313 S Main St
- 313 Main St
- 307 S Main St
- 307 307 Se Main-Street-
- 307 307 S Main
- 301 S Main St SE
- 20 SE Main St SE
- 217 Blomquist St SW
- 15 2nd Ave SE
- 221 Blomquist St SW
- 15 2nd Ave SW
- 19 2nd Ave SW
- 115 SE Main St SE
- 8 2nd Ave SW
- 116 Main St
- 214 Blomquist St SW
- 121 SW Blomquist St
- 121 Renstrom St SE
- 103 2nd Ave SW
- 108 N Main St