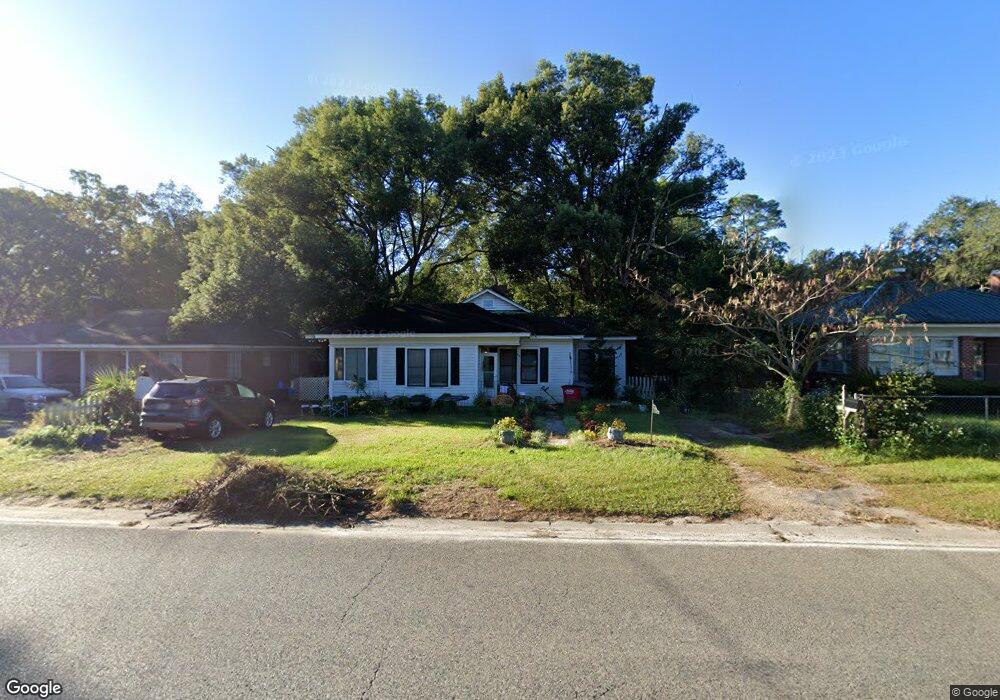
319 Strickland Ave Blackshear, GA 31516
Estimated Value: $143,000 - $174,000
2
Beds
1
Bath
1,261
Sq Ft
$122/Sq Ft
Est. Value
About This Home
This home is located at 319 Strickland Ave, Blackshear, GA 31516 and is currently estimated at $153,312, approximately $121 per square foot. 319 Strickland Ave is a home located in Pierce County with nearby schools including Pierce County High School, Southeast Christian Academy, and Truth Christian Academy.
Ownership History
Date
Name
Owned For
Owner Type
Purchase Details
Closed on
Feb 13, 2007
Sold by
Deloach Sandra J
Bought by
Stafford William L
Current Estimated Value
Home Financials for this Owner
Home Financials are based on the most recent Mortgage that was taken out on this home.
Original Mortgage
$68,000
Outstanding Balance
$40,317
Interest Rate
6.16%
Mortgage Type
New Conventional
Estimated Equity
$112,995
Purchase Details
Closed on
Aug 15, 2002
Sold by
Harrell Ann M
Bought by
Deloach Steven W
Purchase Details
Closed on
Dec 8, 1998
Sold by
Devore Aafke V and Devore Henry F
Bought by
Harrell Ann M
Purchase Details
Closed on
Jan 22, 1998
Sold by
Orser Mary C and Boyett Jane O
Bought by
Devore Aafke V and Devore Henry F
Purchase Details
Closed on
Oct 20, 1997
Sold by
Orser Mary C As Executrix
Bought by
Orser Mary C and Boyett Jane O
Purchase Details
Closed on
Apr 29, 1946
Sold by
Campbell Ora Lee
Bought by
Ward Pearle R
Create a Home Valuation Report for This Property
The Home Valuation Report is an in-depth analysis detailing your home's value as well as a comparison with similar homes in the area
Home Values in the Area
Average Home Value in this Area
Purchase History
| Date | Buyer | Sale Price | Title Company |
|---|---|---|---|
| Stafford William L | $68,000 | -- | |
| Deloach Steven W | $55,000 | -- | |
| Harrell Ann M | $38,000 | -- | |
| Devore Aafke V | $22,600 | -- | |
| Orser Mary C | -- | -- | |
| Ward Pearle R | -- | -- |
Source: Public Records
Mortgage History
| Date | Status | Borrower | Loan Amount |
|---|---|---|---|
| Open | Stafford William L | $68,000 |
Source: Public Records
Tax History Compared to Growth
Tax History
| Year | Tax Paid | Tax Assessment Tax Assessment Total Assessment is a certain percentage of the fair market value that is determined by local assessors to be the total taxable value of land and additions on the property. | Land | Improvement |
|---|---|---|---|---|
| 2025 | $1,478 | $47,395 | $3,330 | $44,065 |
| 2024 | $1,478 | $46,088 | $3,330 | $42,758 |
| 2023 | $1,434 | $44,712 | $3,330 | $41,382 |
| 2022 | $975 | $25,675 | $2,623 | $23,052 |
| 2021 | $1,012 | $24,738 | $2,623 | $22,115 |
| 2020 | $986 | $23,801 | $2,623 | $21,178 |
| 2019 | $986 | $23,801 | $2,623 | $21,178 |
| 2018 | $859 | $20,684 | $2,623 | $18,061 |
| 2017 | $839 | $20,158 | $2,623 | $17,535 |
| 2016 | $837 | $20,158 | $2,623 | $17,535 |
| 2015 | $780 | $20,157 | $2,623 | $17,535 |
| 2014 | $780 | $20,158 | $2,623 | $17,535 |
| 2013 | $780 | $20,157 | $2,622 | $17,534 |
Source: Public Records
Map
Nearby Homes
- 322 Mcgregor St
- 515 Grady St
- 420 Jackson St
- 331 Central Ave W
- 0001 Georgia 121
- ST. ROUTE 121 Georgia 121
- 810 Jackson St
- 3551 Cason Rd
- 706 Jenkins St
- 121 Beaver Dr
- 3360 Strickland Avenue Extension
- 3344 Strickland Ave
- 622 E Main St
- 131 Fawn Ln
- 862 Watson St
- 830 Jane St
- 101 Fawn Ln
- 1157 Tanner Cir
- 915 Jane St
- 2936 Piney Grove Cir
- 315 Strickland Ave
- 323 Strickland Ave
- 307 Strickland Ave
- 332 Strickland Ave
- 406 Strickland Ave
- 409 Strickland Ave
- 317 N Grady St
- 311 Grady St
- 308 Strickland Ave
- 417 Strickland Ave
- 324 Strickland Ave
- 324 Strickland Ave
- 251 Strickland Ave
- 248 Strickland Ave
- 327 Mcgregor St
- 407 Grady St
- 431 Strickland Ave
- 241 Strickland Ave
- 409 Mcgregor St
- 419 Grady St