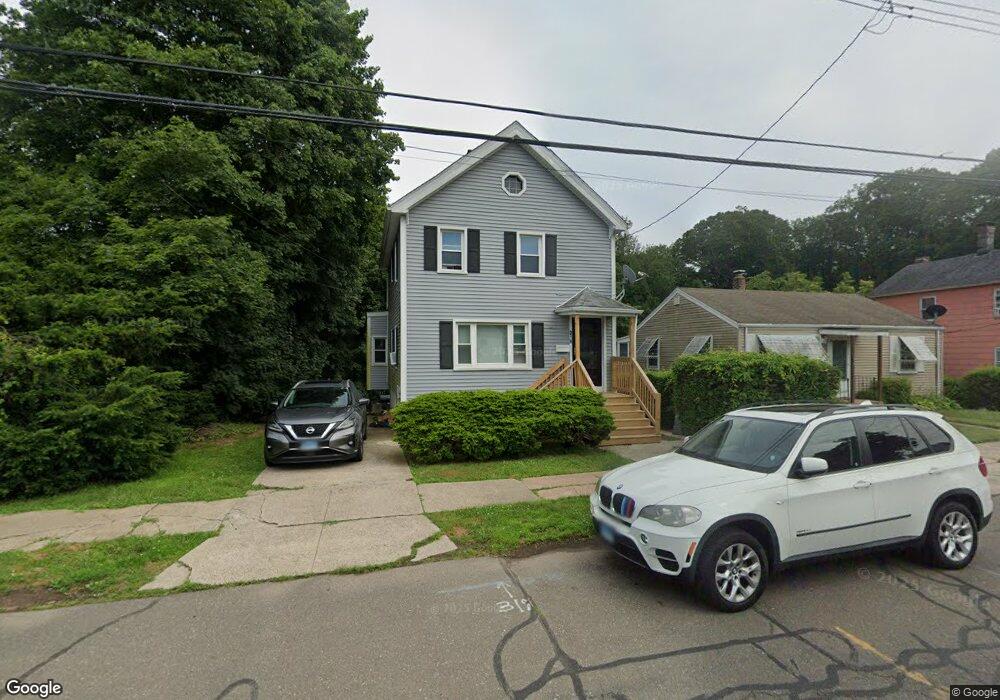
319 Summit St New Haven, CT 06513
Fair Haven Heights NeighborhoodEstimated Value: $256,000 - $338,000
2
Beds
3
Baths
1,354
Sq Ft
$217/Sq Ft
Est. Value
About This Home
This home is located at 319 Summit St, New Haven, CT 06513 and is currently estimated at $293,449, approximately $216 per square foot. 319 Summit St is a home located in New Haven County with nearby schools including Ross Woodward, All Nations Christian Academy, and All Saints Catholic Academy.
Ownership History
Date
Name
Owned For
Owner Type
Purchase Details
Closed on
Nov 20, 1995
Sold by
Vigorito Fleming and Vigorito Raffaela M
Bought by
Blue Janice
Current Estimated Value
Home Financials for this Owner
Home Financials are based on the most recent Mortgage that was taken out on this home.
Original Mortgage
$61,700
Interest Rate
7.53%
Mortgage Type
Unknown
Create a Home Valuation Report for This Property
The Home Valuation Report is an in-depth analysis detailing your home's value as well as a comparison with similar homes in the area
Home Values in the Area
Average Home Value in this Area
Purchase History
| Date | Buyer | Sale Price | Title Company |
|---|---|---|---|
| Blue Janice | $65,000 | -- |
Source: Public Records
Mortgage History
| Date | Status | Borrower | Loan Amount |
|---|---|---|---|
| Open | Blue Janice | $170,400 | |
| Closed | Blue Janice | $130,000 | |
| Closed | Blue Janice | $3,507 | |
| Closed | Blue Janice | $61,700 |
Source: Public Records
Tax History
| Year | Tax Paid | Tax Assessment Tax Assessment Total Assessment is a certain percentage of the fair market value that is determined by local assessors to be the total taxable value of land and additions on the property. | Land | Improvement |
|---|---|---|---|---|
| 2025 | $5,237 | $132,930 | $38,570 | $94,360 |
| 2024 | $4,652 | $120,820 | $38,570 | $82,250 |
| 2023 | $4,495 | $120,820 | $38,570 | $82,250 |
| 2022 | $4,803 | $120,820 | $38,570 | $82,250 |
| 2021 | $3,926 | $89,460 | $24,640 | $64,820 |
| 2020 | $3,926 | $89,460 | $24,640 | $64,820 |
| 2019 | $3,845 | $89,460 | $24,640 | $64,820 |
| 2018 | $3,845 | $89,460 | $24,640 | $64,820 |
| 2017 | $3,460 | $89,460 | $24,640 | $64,820 |
| 2016 | $3,784 | $91,070 | $27,720 | $63,350 |
| 2015 | $3,784 | $91,070 | $27,720 | $63,350 |
| 2014 | $3,784 | $91,070 | $27,720 | $63,350 |
Source: Public Records
Map
Nearby Homes
- 89 Sherland Ave
- 314 Lenox St
- 728 Quinnipiac Ave
- 702 Quinnipiac Ave Unit A
- 95 Lenox St Unit L
- 231 Russell St
- 31 Marie St Unit B
- 100 Front St Unit 100
- 926 Quinnipiac Ave Unit 8
- 1 Front St Unit 1 Kel
- 39 Houston St
- 20 Warwick St
- 72 Pierpont St
- 25 Pine St
- 191 Ferry St
- 193 Farren Ave
- 190 Farren Ave
- 169 Farren Ave
- 247 Fairmont Ave
- 35 Saltonstall Ave
Your Personal Tour Guide
Ask me questions while you tour the home.