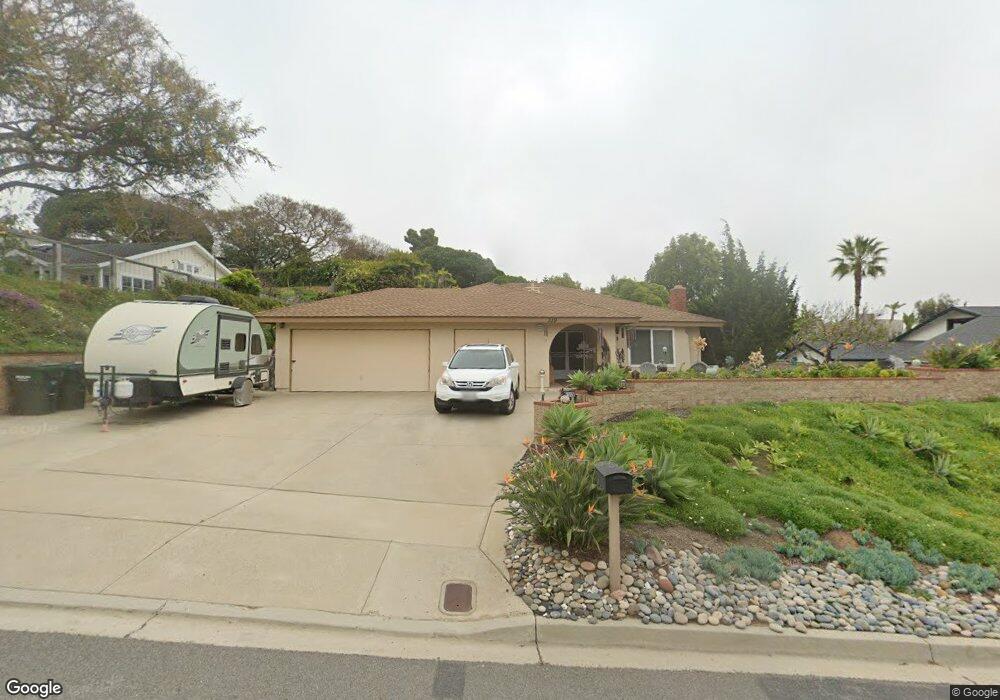
319 Via Julita Encinitas, CA 92024
Central Encinitas NeighborhoodEstimated Value: $1,553,878 - $2,524,000
3
Beds
2
Baths
1,453
Sq Ft
$1,324/Sq Ft
Est. Value
About This Home
This home is located at 319 Via Julita, Encinitas, CA 92024 and is currently estimated at $1,923,720, approximately $1,323 per square foot. 319 Via Julita is a home located in San Diego County with nearby schools including Paul Ecke-Central Elementary, Diegueno Middle School, and La Costa Canyon High School.
Ownership History
Date
Name
Owned For
Owner Type
Purchase Details
Closed on
Jan 1, 2017
Sold by
Leipper Liana Elaine
Bought by
Leipper Liana Elaine and Leipper John Ian
Current Estimated Value
Purchase Details
Closed on
Feb 20, 2002
Sold by
Leipper John Elliott and Leipper Liana Elaine
Bought by
Leipper John Elliott and Leipper Liana Elaine
Purchase Details
Closed on
Sep 12, 1996
Sold by
Leipper John E and Leipper Liana E
Bought by
Leipper John Elliott and Leipper Liana Elaine
Purchase Details
Closed on
Sep 9, 1996
Sold by
Leipper John E and Leipper Liana E
Bought by
Leipper John Elliott and Leipper Liana Elaine
Purchase Details
Closed on
Jul 10, 1996
Sold by
Leipper John E and Leipper Liana E
Bought by
Leipper John Elliott and Leipper Liana Elaine
Home Financials for this Owner
Home Financials are based on the most recent Mortgage that was taken out on this home.
Original Mortgage
$77,000
Interest Rate
8.39%
Create a Home Valuation Report for This Property
The Home Valuation Report is an in-depth analysis detailing your home's value as well as a comparison with similar homes in the area
Home Values in the Area
Average Home Value in this Area
Purchase History
| Date | Buyer | Sale Price | Title Company |
|---|---|---|---|
| Leipper Liana Elaine | -- | None Available | |
| Leipper John Elliott | -- | -- | |
| Leipper John Elliott | -- | -- | |
| Leipper John Elliott | -- | -- | |
| Leipper John Elliott | -- | First American Title Ins Co |
Source: Public Records
Mortgage History
| Date | Status | Borrower | Loan Amount |
|---|---|---|---|
| Closed | Leipper John Elliott | $77,000 |
Source: Public Records
Tax History Compared to Growth
Tax History
| Year | Tax Paid | Tax Assessment Tax Assessment Total Assessment is a certain percentage of the fair market value that is determined by local assessors to be the total taxable value of land and additions on the property. | Land | Improvement |
|---|---|---|---|---|
| 2025 | $2,012 | $142,954 | $53,340 | $89,614 |
| 2024 | $2,012 | $140,152 | $52,295 | $87,857 |
| 2023 | $1,907 | $137,405 | $51,270 | $86,135 |
| 2022 | $1,874 | $134,712 | $50,265 | $84,447 |
| 2021 | $1,770 | $132,072 | $49,280 | $82,792 |
| 2020 | $1,908 | $130,719 | $48,775 | $81,944 |
| 2019 | $1,878 | $128,157 | $47,819 | $80,338 |
| 2018 | $1,810 | $125,645 | $46,882 | $78,763 |
| 2017 | $1,731 | $123,182 | $45,963 | $77,219 |
| 2016 | $1,685 | $120,767 | $45,062 | $75,705 |
| 2015 | $1,696 | $118,954 | $44,386 | $74,568 |
| 2014 | $1,611 | $116,625 | $43,517 | $73,108 |
Source: Public Records
Map
Nearby Homes
- 406 Paseo Pacifica
- 147 4th St
- 201 4th St Unit A & B
- 112 La Veta Ave
- 239 4th St
- 431 Orpheus Ave
- 231 5th St
- 458 3rd St
- 200 Neptune Ave Unit 2
- 647 San Dieguito Dr
- 614 Ocean View Ave
- Seaside Plan at Ocean Knoll
- Stonesteps Plan at Ocean Knoll
- Moonlight Plan at Ocean Knoll
- Swami's Plan at Ocean Knoll
- Grandview Plan at Ocean Knoll
- Pipes Plan at Ocean Knoll
- Reef Plan at Ocean Knoll
- Ponto Plan at Ocean Knoll
- Beacons Plan at Ocean Knoll
- 327 Via Julita
- 311 Via Julita
- 318 Via Nancita
- 310 Via Nancita
- 316 Via Julita
- 326 Via Nancita
- 324 Via Julita
- 303 Via Julita
- 304 Via Julita
- 403 Arroyo Dr
- 302 Via Nancita
- 426 Arroyo Dr
- 0 Arroyo Dr
- 317 Via Nancita
- 325 Via Nancita
- 253 Ocean View Ave
- 267 Ocean View Ave
- 375 Arroyo Dr Unit 375375A
- 309 Via Nancita
- 329 Via Nancita