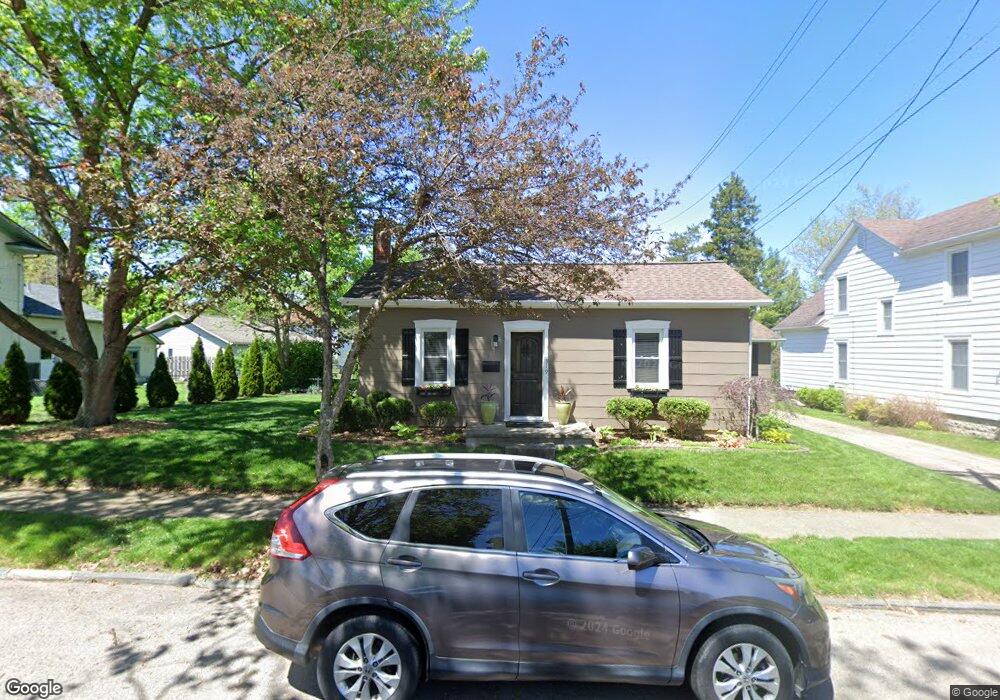
319 W Walnut St Tipp City, OH 45371
Estimated Value: $181,000 - $208,000
2
Beds
1
Bath
1,061
Sq Ft
$184/Sq Ft
Est. Value
About This Home
This home is located at 319 W Walnut St, Tipp City, OH 45371 and is currently estimated at $195,224, approximately $184 per square foot. 319 W Walnut St is a home located in Miami County with nearby schools including Broadway Elementary School, Nevin Coppock Elementary School, and L. T. Ball Intermediate School.
Ownership History
Date
Name
Owned For
Owner Type
Purchase Details
Closed on
Aug 13, 2007
Sold by
Matthews Mark F and Matthews Shannon F
Bought by
Kussman Gregory L
Current Estimated Value
Home Financials for this Owner
Home Financials are based on the most recent Mortgage that was taken out on this home.
Original Mortgage
$107,000
Outstanding Balance
$67,920
Interest Rate
6.71%
Mortgage Type
New Conventional
Estimated Equity
$127,304
Purchase Details
Closed on
May 5, 2005
Sold by
Matthews H Thomas
Bought by
Matthews Mark F and Matthews Shannon F
Home Financials for this Owner
Home Financials are based on the most recent Mortgage that was taken out on this home.
Original Mortgage
$38,320
Interest Rate
6.05%
Mortgage Type
New Conventional
Purchase Details
Closed on
Apr 1, 1988
Bought by
Matthews H Thomas
Create a Home Valuation Report for This Property
The Home Valuation Report is an in-depth analysis detailing your home's value as well as a comparison with similar homes in the area
Home Values in the Area
Average Home Value in this Area
Purchase History
| Date | Buyer | Sale Price | Title Company |
|---|---|---|---|
| Kussman Gregory L | $107,000 | -- | |
| Matthews Mark F | $47,900 | -- | |
| Matthews H Thomas | -- | -- |
Source: Public Records
Mortgage History
| Date | Status | Borrower | Loan Amount |
|---|---|---|---|
| Open | Matthews Mark F | $107,000 | |
| Previous Owner | Matthews Mark F | $38,320 |
Source: Public Records
Tax History Compared to Growth
Tax History
| Year | Tax Paid | Tax Assessment Tax Assessment Total Assessment is a certain percentage of the fair market value that is determined by local assessors to be the total taxable value of land and additions on the property. | Land | Improvement |
|---|---|---|---|---|
| 2024 | $1,735 | $44,660 | $15,750 | $28,910 |
| 2023 | $1,735 | $44,660 | $15,750 | $28,910 |
| 2022 | $2,026 | $44,660 | $15,750 | $28,910 |
| 2021 | $1,718 | $34,340 | $12,110 | $22,230 |
| 2020 | $1,740 | $34,340 | $12,110 | $22,230 |
| 2019 | $1,755 | $34,340 | $12,110 | $22,230 |
| 2018 | $1,426 | $26,040 | $12,600 | $13,440 |
| 2017 | $1,432 | $26,040 | $12,600 | $13,440 |
| 2016 | $1,384 | $26,040 | $12,600 | $13,440 |
| 2015 | $1,209 | $24,120 | $11,660 | $12,460 |
| 2014 | $1,209 | $24,120 | $11,660 | $12,460 |
| 2013 | $1,215 | $24,120 | $11,660 | $12,460 |
Source: Public Records
Map
Nearby Homes