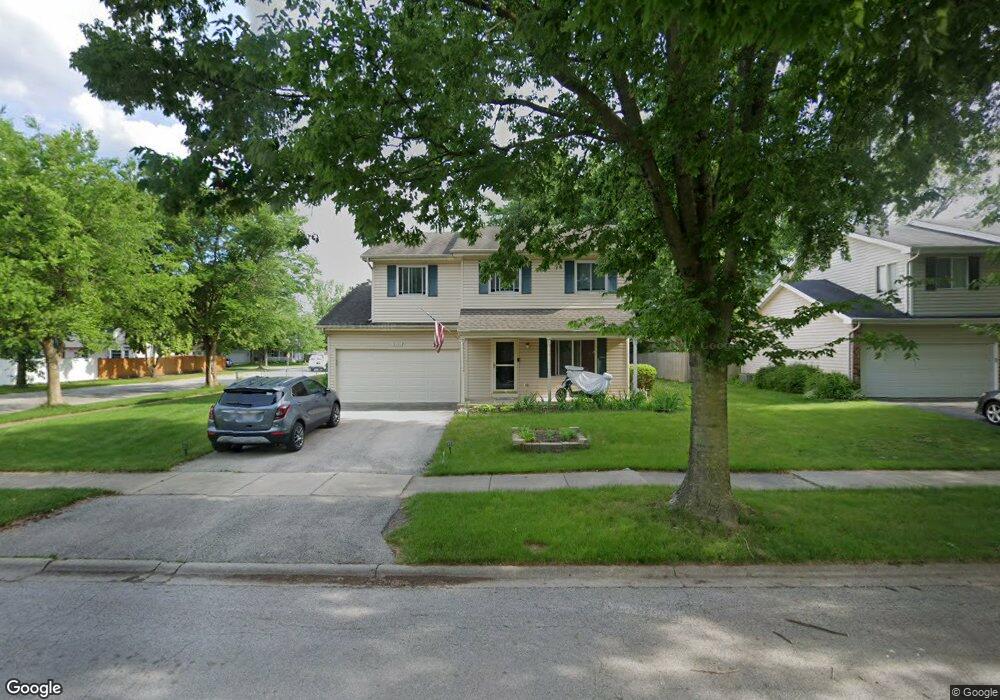
3191 Andover Ct Unit 19F Aurora, IL 60504
South East Village NeighborhoodEstimated Value: $393,000 - $474,000
4
Beds
3
Baths
1,944
Sq Ft
$214/Sq Ft
Est. Value
About This Home
This home is located at 3191 Andover Ct Unit 19F, Aurora, IL 60504 and is currently estimated at $415,574, approximately $213 per square foot. 3191 Andover Ct Unit 19F is a home located in DuPage County with nearby schools including Gombert Elementary School, Mill Street Elementary School, and Fischer Middle School.
Ownership History
Date
Name
Owned For
Owner Type
Purchase Details
Closed on
Apr 14, 2017
Sold by
Neill John P O and Neill Elisa M O
Bought by
Contractor Ashok B and Contractor Dina A
Current Estimated Value
Home Financials for this Owner
Home Financials are based on the most recent Mortgage that was taken out on this home.
Original Mortgage
$212,578
Outstanding Balance
$177,090
Interest Rate
4.25%
Mortgage Type
FHA
Estimated Equity
$238,484
Purchase Details
Closed on
Jan 10, 1996
Sold by
Crawford John M and Crawford Robbie Ann
Bought by
Oneill John P and Oneill Elisa M
Home Financials for this Owner
Home Financials are based on the most recent Mortgage that was taken out on this home.
Original Mortgage
$133,896
Interest Rate
7.36%
Mortgage Type
FHA
Create a Home Valuation Report for This Property
The Home Valuation Report is an in-depth analysis detailing your home's value as well as a comparison with similar homes in the area
Home Values in the Area
Average Home Value in this Area
Purchase History
| Date | Buyer | Sale Price | Title Company |
|---|---|---|---|
| Contractor Ashok B | $216,500 | First American Title | |
| Oneill John P | $136,000 | -- |
Source: Public Records
Mortgage History
| Date | Status | Borrower | Loan Amount |
|---|---|---|---|
| Open | Contractor Ashok B | $212,578 | |
| Previous Owner | Oneill John P | $133,896 |
Source: Public Records
Tax History Compared to Growth
Tax History
| Year | Tax Paid | Tax Assessment Tax Assessment Total Assessment is a certain percentage of the fair market value that is determined by local assessors to be the total taxable value of land and additions on the property. | Land | Improvement |
|---|---|---|---|---|
| 2024 | $7,429 | $105,703 | $22,547 | $83,156 |
| 2023 | $7,069 | $94,980 | $20,260 | $74,720 |
| 2022 | $6,592 | $84,610 | $17,890 | $66,720 |
| 2021 | $6,592 | $81,590 | $17,250 | $64,340 |
| 2020 | $6,491 | $81,590 | $17,250 | $64,340 |
| 2019 | $6,255 | $77,600 | $16,410 | $61,190 |
| 2018 | $5,429 | $67,470 | $14,390 | $53,080 |
| 2017 | $5,332 | $65,180 | $13,900 | $51,280 |
| 2016 | $5,229 | $62,550 | $13,340 | $49,210 |
| 2015 | $5,164 | $59,390 | $12,670 | $46,720 |
| 2014 | $5,752 | $63,730 | $13,490 | $50,240 |
| 2013 | $5,694 | $64,170 | $13,580 | $50,590 |
Source: Public Records
Map
Nearby Homes
- 3290 Johnsbury Ct
- 3144 Johnsbury Ln
- 2860 Bridgeport Ln Unit 19D
- 1334 Normantown Rd Unit 334
- 1465 Bridgeport Ln Unit 19D
- 2730 Dorothy Dr Unit 1
- 1335 Lawrence Ct
- 3264 Oak Creek Ln
- 2723 Rosehall Ln
- 3185 Ketch Ct Unit 606
- 2632 Emma Cir
- 10S154 Schoger Dr
- 2077 Union Mill Dr
- 3288 Wildlight Rd
- 3479 Charlemaine Dr
- 3467 Charlemaine Dr
- 2509 Rosehall Ln
- 2489 Rosehall Ln
- 3437 Charlemaine Dr
- 2538 Needham Ct
- 3171 Andover Ct
- 3100 Johnsbury Ln Unit 19F
- 3110 Johnsbury Ln
- 3151 Andover Ct
- 3201 Andover Dr
- 3190 Andover Ct
- 3114 Johnsbury Ln
- 3170 Andover Ct
- 3200 Johnsbury Ct
- 3131 Andover Ct
- 3150 Andover Ct Unit 19F
- 3200 Andover Dr
- 3120 Johnsbury Ln
- 3211 Andover Dr
- 3210 Johnsbury Ct
- 3130 Andover Ct Unit 19F
- 3105 Johnsbury Ln Unit 19F
- 3111 Andover Ct
- 3158 Boothbay Ln
- 3210 Andover Dr