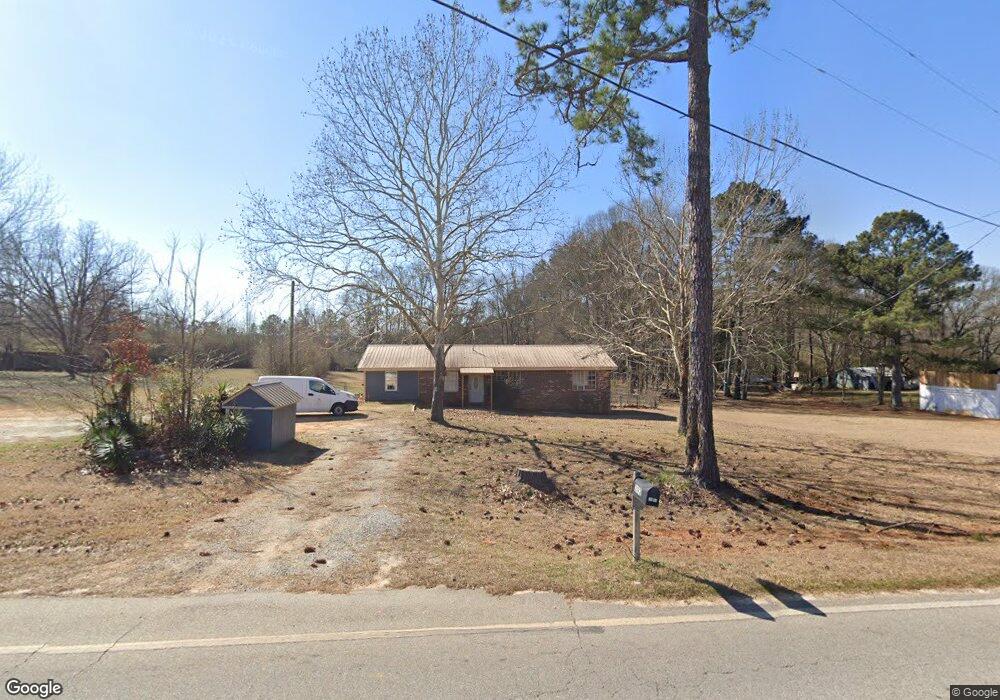
3192 Teamon Rd Griffin, GA 30223
Spalding County NeighborhoodEstimated Value: $168,448 - $193,000
3
Beds
1
Bath
1,075
Sq Ft
$168/Sq Ft
Est. Value
About This Home
This home is located at 3192 Teamon Rd, Griffin, GA 30223 and is currently estimated at $180,612, approximately $168 per square foot. 3192 Teamon Rd is a home located in Spalding County with nearby schools including Jordan Hill Road Elementary School, Kennedy Road Middle School, and Spalding High School.
Ownership History
Date
Name
Owned For
Owner Type
Purchase Details
Closed on
Dec 3, 2003
Sold by
Mcfarland John W and Mcfarland Dolores W
Bought by
Strickland Samuel T and Strickland Romy
Current Estimated Value
Home Financials for this Owner
Home Financials are based on the most recent Mortgage that was taken out on this home.
Original Mortgage
$60,300
Outstanding Balance
$28,312
Interest Rate
6.07%
Mortgage Type
New Conventional
Estimated Equity
$152,300
Purchase Details
Closed on
Jul 1, 1986
Sold by
Foster Melanie K
Bought by
Mcfarland John W and Mcfarland Dolores W
Purchase Details
Closed on
Jan 4, 1982
Sold by
Foster Kenneth E and Foster Malanie K
Bought by
Foster Melanie K
Purchase Details
Closed on
Sep 14, 1978
Sold by
H & M Builders Inc
Bought by
Foster Kenneth E and Foster Melanie K
Purchase Details
Closed on
May 3, 1978
Sold by
Smith Fred Etal
Bought by
H & M Builders Inc
Purchase Details
Closed on
Sep 27, 1977
Bought by
Smith Fred Etal
Create a Home Valuation Report for This Property
The Home Valuation Report is an in-depth analysis detailing your home's value as well as a comparison with similar homes in the area
Home Values in the Area
Average Home Value in this Area
Purchase History
| Date | Buyer | Sale Price | Title Company |
|---|---|---|---|
| Strickland Samuel T | $67,000 | -- | |
| Mcfarland John W | $34,500 | -- | |
| Foster Melanie K | $1,000 | -- | |
| Foster Kenneth E | $23,700 | -- | |
| H & M Builders Inc | $5,000 | -- | |
| Smith Fred Etal | -- | -- |
Source: Public Records
Mortgage History
| Date | Status | Borrower | Loan Amount |
|---|---|---|---|
| Open | Strickland Samuel T | $60,300 |
Source: Public Records
Tax History Compared to Growth
Tax History
| Year | Tax Paid | Tax Assessment Tax Assessment Total Assessment is a certain percentage of the fair market value that is determined by local assessors to be the total taxable value of land and additions on the property. | Land | Improvement |
|---|---|---|---|---|
| 2024 | $1,136 | $31,749 | $8,554 | $23,195 |
| 2023 | $1,136 | $31,749 | $8,554 | $23,195 |
| 2022 | $1,005 | $27,647 | $7,128 | $20,519 |
| 2021 | $920 | $25,296 | $7,128 | $18,168 |
| 2020 | $849 | $23,277 | $7,128 | $16,149 |
| 2019 | $866 | $23,277 | $7,128 | $16,149 |
| 2018 | $830 | $21,723 | $7,128 | $14,595 |
| 2017 | $808 | $21,723 | $7,128 | $14,595 |
| 2016 | $822 | $21,723 | $7,128 | $14,595 |
| 2015 | $847 | $21,723 | $7,128 | $14,595 |
| 2014 | $863 | $21,723 | $7,128 | $14,595 |
Source: Public Records
Map
Nearby Homes
- 3232 Teamon Rd
- 3264 Teamon Rd
- 2985 Teamon Rd
- Belfort Plan at Teamon Pointe
- Hayden Plan at Teamon Pointe
- Galen Plan at Teamon Pointe
- Penwell Plan at Teamon Pointe
- 1002 Queens Bridge Way
- 2270 N Mcdonough Rd
- 176 Smoak Field Rd
- 2050 N Mcdonough Rd
- 1013 Queens Bridge Way
- 1015 Queens Bridge Way
- 1017 Queens Bridge Way
- 1131 Leconte Ct
- 615 N Mcdonough Rd
- 1020 Queens Bridge Way
- 1134 Leconte Ct
- 1225 Bartam Dr
- 109 Gainer Rd