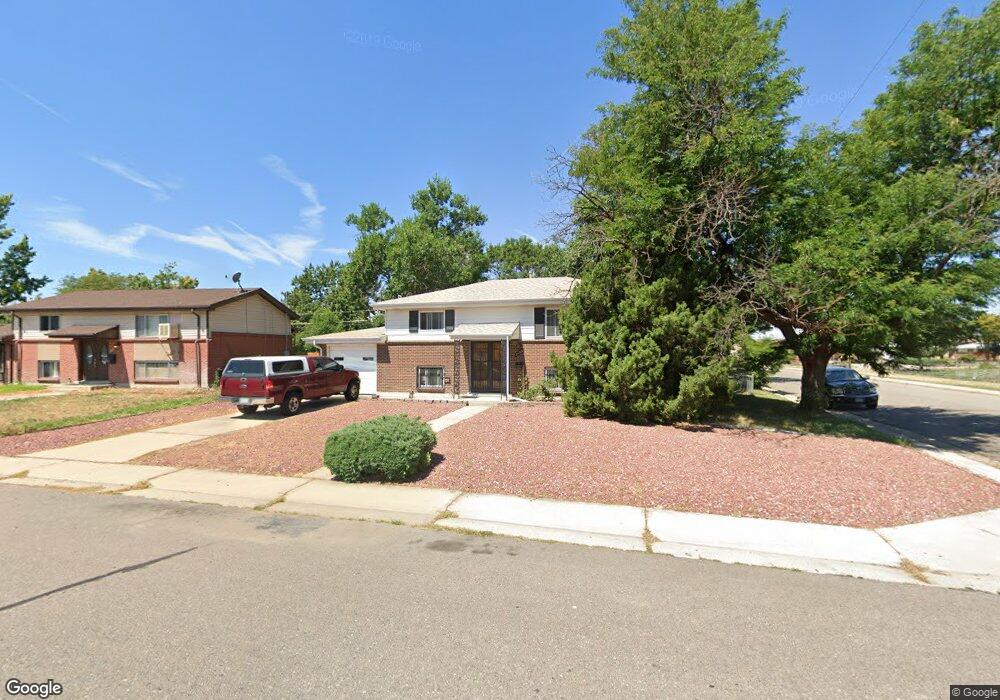
3193 Abilene St Aurora, CO 80011
Sable Altura Chambers NeighborhoodEstimated Value: $361,000 - $466,000
5
Beds
2
Baths
1,728
Sq Ft
$245/Sq Ft
Est. Value
About This Home
This home is located at 3193 Abilene St, Aurora, CO 80011 and is currently estimated at $423,613, approximately $245 per square foot. 3193 Abilene St is a home located in Adams County with nearby schools including Park Lane Elementary School, North Middle School Health Sciences & Technology, and Hinkley High School.
Ownership History
Date
Name
Owned For
Owner Type
Purchase Details
Closed on
Jun 25, 2007
Sold by
Residential Funding Co Llc
Bought by
Solis Moez
Current Estimated Value
Home Financials for this Owner
Home Financials are based on the most recent Mortgage that was taken out on this home.
Original Mortgage
$107,910
Outstanding Balance
$65,851
Interest Rate
6.41%
Mortgage Type
Unknown
Estimated Equity
$357,762
Purchase Details
Closed on
May 23, 2007
Sold by
Nunez Felipe
Bought by
Residential Funding Company Llc
Home Financials for this Owner
Home Financials are based on the most recent Mortgage that was taken out on this home.
Original Mortgage
$107,910
Outstanding Balance
$65,851
Interest Rate
6.41%
Mortgage Type
Unknown
Estimated Equity
$357,762
Purchase Details
Closed on
Aug 22, 2005
Sold by
Oppenlander Alan Edward
Bought by
Nunez Felipe
Home Financials for this Owner
Home Financials are based on the most recent Mortgage that was taken out on this home.
Original Mortgage
$144,000
Interest Rate
5.9%
Mortgage Type
Unknown
Create a Home Valuation Report for This Property
The Home Valuation Report is an in-depth analysis detailing your home's value as well as a comparison with similar homes in the area
Home Values in the Area
Average Home Value in this Area
Purchase History
| Date | Buyer | Sale Price | Title Company |
|---|---|---|---|
| Solis Moez | $119,900 | Service Link | |
| Residential Funding Company Llc | -- | None Available | |
| Nunez Felipe | $180,000 | Fahtco |
Source: Public Records
Mortgage History
| Date | Status | Borrower | Loan Amount |
|---|---|---|---|
| Open | Solis Moez | $107,910 | |
| Previous Owner | Nunez Felipe | $144,000 |
Source: Public Records
Tax History
| Year | Tax Paid | Tax Assessment Tax Assessment Total Assessment is a certain percentage of the fair market value that is determined by local assessors to be the total taxable value of land and additions on the property. | Land | Improvement |
|---|---|---|---|---|
| 2025 | $2,646 | $26,790 | $5,780 | $21,010 |
| 2024 | $2,646 | $24,620 | $5,310 | $19,310 |
| 2023 | $2,688 | $28,950 | $5,750 | $23,200 |
| 2022 | $2,269 | $19,970 | $5,490 | $14,480 |
| 2021 | $2,364 | $19,970 | $5,490 | $14,480 |
| 2020 | $2,555 | $21,650 | $5,650 | $16,000 |
| 2019 | $2,550 | $21,650 | $5,650 | $16,000 |
| 2018 | $2,015 | $17,030 | $5,040 | $11,990 |
| 2017 | $1,790 | $17,030 | $5,040 | $11,990 |
| 2016 | $1,249 | $11,790 | $2,590 | $9,200 |
| 2015 | $1,210 | $11,790 | $2,590 | $9,200 |
| 2014 | $1,046 | $10,030 | $2,150 | $7,880 |
Source: Public Records
Map
Nearby Homes
- 3065 Zion St
- 3131 Xanadu St
- 3090 Worchester St
- 3222 Blackhawk Cir
- 3008 Zion St
- 3055 Carson St
- 3206 Vaughn St
- 3123 Uvalda St
- 3219 Uvalda St
- 2507 Zion St
- 2671 Sable Blvd
- 2621 Sable Blvd
- 14280 E 22nd Place
- 2110 Eagle Cir
- 1957 Blackhawk St
- 1959 Blackhawk St
- 1953 Blackhawk St
- 14400 Albrook Dr Unit 55
- 14400 Albrook Dr Unit 80
- 4345 Sable St
- 3181 Abilene St
- 3196 Zion St
- 3188 Zion St
- 3215 Abilene Cir
- 3163 Abilene St
- 3176 Zion St
- 3206 Abilene Cir
- 3198 Abilene St
- 3164 Zion St
- 3151 Abilene St
- 3168 Abilene St
- 13702 E 32nd Place
- 3226 Abilene Cir
- 13784 E 32nd Place
- 3150 Zion St
- 3213 Atchison Cir
- 3148 Abilene St
- 3133 Abilene St
- 3223 Atchison Cir
- 3191 Atchison St
Your Personal Tour Guide
Ask me questions while you tour the home.