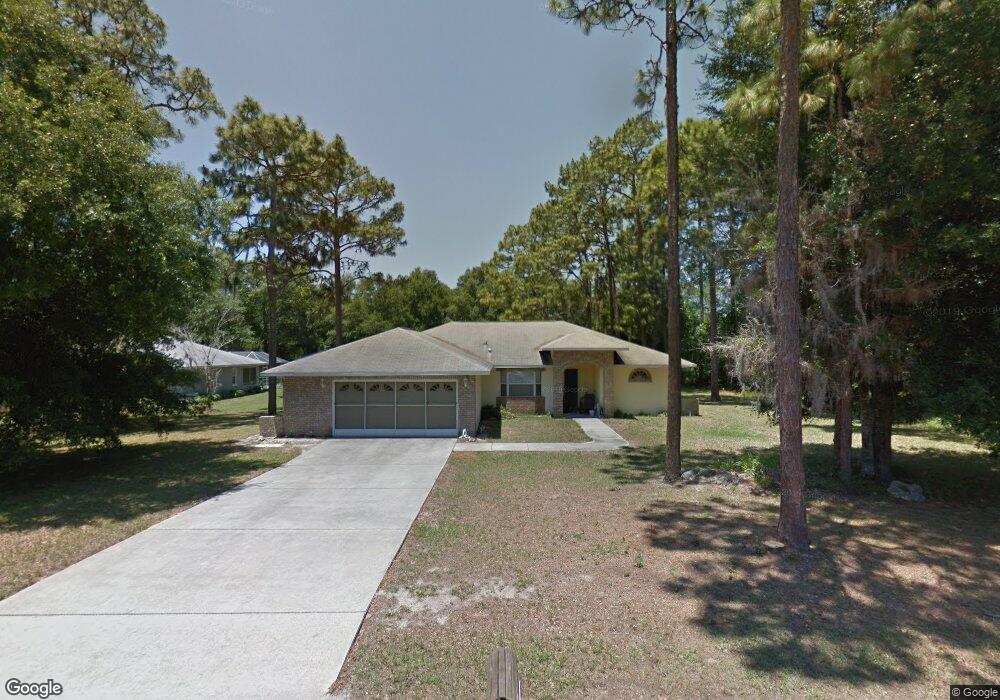
3194 S Cygnet Point Inverness, FL 34450
Estimated Value: $289,677 - $352,000
3
Beds
2
Baths
1,678
Sq Ft
$191/Sq Ft
Est. Value
About This Home
This home is located at 3194 S Cygnet Point, Inverness, FL 34450 and is currently estimated at $320,669, approximately $191 per square foot. 3194 S Cygnet Point is a home located in Citrus County with nearby schools including Inverness Primary School, Inverness Middle School, and Citrus High School.
Ownership History
Date
Name
Owned For
Owner Type
Purchase Details
Closed on
Jul 14, 2014
Sold by
Mcmahon Dolres and Mcmahon Lowell D
Bought by
Mcmahon Lowell and Kyburz Sheila
Current Estimated Value
Purchase Details
Closed on
Nov 5, 2002
Sold by
Kyburz Sheila Lynn
Bought by
Mcmahon Lowell D and Mcmahon Dolores
Purchase Details
Closed on
Dec 7, 2001
Sold by
Creel Cheryl and Creel Charles
Bought by
Kyburz Sheila L
Home Financials for this Owner
Home Financials are based on the most recent Mortgage that was taken out on this home.
Original Mortgage
$224,000
Interest Rate
6.5%
Purchase Details
Closed on
May 22, 2000
Sold by
Kyburz Timothy C L and Kyburz Sheila L
Bought by
Kyburz Sheila L and Kyburz Sheila Lynn
Purchase Details
Closed on
May 1, 2000
Bought by
Mcmahon Dolores
Purchase Details
Closed on
Aug 1, 1998
Bought by
Mcmahon Dolores
Purchase Details
Closed on
Aug 1, 1996
Bought by
Mcmahon Dolores
Create a Home Valuation Report for This Property
The Home Valuation Report is an in-depth analysis detailing your home's value as well as a comparison with similar homes in the area
Home Values in the Area
Average Home Value in this Area
Purchase History
| Date | Buyer | Sale Price | Title Company |
|---|---|---|---|
| Mcmahon Lowell | -- | Attorney | |
| Mcmahon Lowell D | $82,000 | -- | |
| Kyburz Sheila L | $280,000 | First Title Company Inc | |
| Kyburz Sheila L | -- | -- | |
| Mcmahon Dolores | $100 | -- | |
| Mcmahon Dolores | $115,900 | -- | |
| Mcmahon Dolores | $12,500 | -- |
Source: Public Records
Mortgage History
| Date | Status | Borrower | Loan Amount |
|---|---|---|---|
| Previous Owner | Kyburz Sheila L | $224,000 |
Source: Public Records
Tax History Compared to Growth
Tax History
| Year | Tax Paid | Tax Assessment Tax Assessment Total Assessment is a certain percentage of the fair market value that is determined by local assessors to be the total taxable value of land and additions on the property. | Land | Improvement |
|---|---|---|---|---|
| 2025 | $1,185 | $118,128 | -- | -- |
| 2024 | $1,146 | $114,799 | -- | -- |
| 2023 | $1,146 | $111,455 | $0 | $0 |
| 2022 | $1,135 | $108,209 | $0 | $0 |
| 2021 | $1,088 | $105,057 | $0 | $0 |
| 2020 | $1,024 | $117,554 | $11,050 | $106,504 |
| 2019 | $1,006 | $107,362 | $11,050 | $96,312 |
| 2018 | $975 | $128,204 | $11,050 | $117,154 |
| 2017 | $966 | $97,346 | $13,180 | $84,166 |
| 2016 | $971 | $95,344 | $13,180 | $82,164 |
| 2015 | $981 | $94,681 | $12,400 | $82,281 |
| 2014 | $996 | $93,930 | $13,628 | $80,302 |
Source: Public Records
Map
Nearby Homes
- 3030 S Bay Berry Point
- 3103 S Bay Berry Point
- 2840 S Eagle Terrace
- 2908 S Skyline Dr
- 3203 S Skyline Dr
- 3499 S Stroud Terrace
- 9051 E China Grove Ln
- 3061 S Franklin Terrace
- 9495 E Baymeadows Dr
- 2550 S Bali Point
- 3002 S Rose Ave
- 3341 S Jean Point
- 9515 E Baymeadows Dr
- 9546 E Baymeadows Dr
- 9520 E Baymeadows Dr
- 3966 S Killdeer Ave
- 3862 S Killdeer Ave
- 4010 S Killdeer Ave
- 3995 S Reflection Ave
- 8831 E Sandpiper Dr
- 3214 S Cygnet Point
- 3172 S Cygnet Terrace
- 3152 S Cygnet Terrace
- 3195 S Cygnet Point
- 3232 S Cygnet Point
- 9545 E Woodmere Ln
- 3233 S Cygnet Point
- 3135 S Buckley Point
- 3130 S Cygnet Terrace
- 3248 S Cygnet Point
- 3203 S Buckley Point
- 3129 S Buckley Point
- 3143 S Cygnet Terrace
- 3117 S Buckley Point Unit 7508
- 3110 S Cygnet Terrace
- 3270 S Cygnet Point
- 9590 E Woodmere Ln
- 3251 S Cygnet Point
- 3109 S Cygnet Terrace
- 3126 S Eagle Terrace