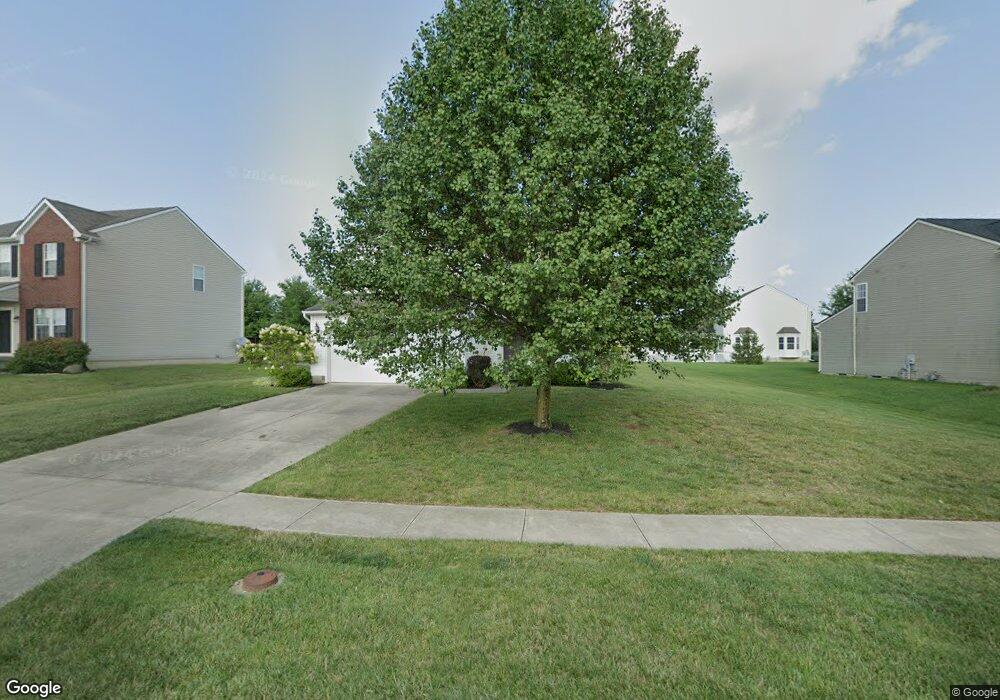
3196 Running Deer Trail Franklin, OH 45005
Estimated Value: $350,586 - $403,000
3
Beds
3
Baths
1,840
Sq Ft
$201/Sq Ft
Est. Value
About This Home
This home is located at 3196 Running Deer Trail, Franklin, OH 45005 and is currently estimated at $369,397, approximately $200 per square foot. 3196 Running Deer Trail is a home located in Warren County with nearby schools including Clearcreek Elementary School, Dennis Elementary School, and Springboro Intermediate School.
Ownership History
Date
Name
Owned For
Owner Type
Purchase Details
Closed on
Aug 26, 2010
Sold by
Bohman Seanna
Bought by
Bohman Seanna and Bohman Kathleen
Current Estimated Value
Home Financials for this Owner
Home Financials are based on the most recent Mortgage that was taken out on this home.
Original Mortgage
$160,040
Outstanding Balance
$106,534
Interest Rate
4.6%
Mortgage Type
FHA
Estimated Equity
$262,863
Purchase Details
Closed on
Jul 17, 2008
Sold by
Nvr Inc
Bought by
Bohman Seanna N and Bohman Kathleen
Home Financials for this Owner
Home Financials are based on the most recent Mortgage that was taken out on this home.
Original Mortgage
$160,678
Interest Rate
6.51%
Mortgage Type
FHA
Purchase Details
Closed on
Apr 23, 2008
Sold by
Todd Development Co Inc
Bought by
Nvr Inc
Create a Home Valuation Report for This Property
The Home Valuation Report is an in-depth analysis detailing your home's value as well as a comparison with similar homes in the area
Home Values in the Area
Average Home Value in this Area
Purchase History
| Date | Buyer | Sale Price | Title Company |
|---|---|---|---|
| Bohman Seanna | -- | Midwest Title Co | |
| Bohman Seanna | -- | Midwest Title Company | |
| Bohman Seanna N | $163,200 | 1St Title | |
| Nvr Inc | $62,000 | First Title |
Source: Public Records
Mortgage History
| Date | Status | Borrower | Loan Amount |
|---|---|---|---|
| Open | Bohman Seanna | $160,040 | |
| Closed | Bohman Seanna N | $160,678 |
Source: Public Records
Tax History Compared to Growth
Tax History
| Year | Tax Paid | Tax Assessment Tax Assessment Total Assessment is a certain percentage of the fair market value that is determined by local assessors to be the total taxable value of land and additions on the property. | Land | Improvement |
|---|---|---|---|---|
| 2024 | $3,209 | $87,980 | $24,500 | $63,480 |
| 2023 | $2,702 | $68,463 | $14,455 | $54,008 |
| 2022 | $2,652 | $68,464 | $14,455 | $54,009 |
| 2021 | $2,452 | $68,464 | $14,455 | $54,009 |
| 2020 | $2,375 | $58,020 | $12,250 | $45,770 |
| 2019 | $2,388 | $58,020 | $12,250 | $45,770 |
| 2018 | $2,388 | $58,020 | $12,250 | $45,770 |
| 2017 | $2,262 | $49,518 | $10,486 | $39,032 |
| 2016 | $2,362 | $49,518 | $10,486 | $39,032 |
| 2015 | $2,368 | $49,518 | $10,486 | $39,032 |
| 2014 | $2,325 | $46,710 | $9,890 | $36,820 |
| 2013 | $2,323 | $57,850 | $12,250 | $45,600 |
Source: Public Records
Map
Nearby Homes
- 3600 Yellow Finch Way
- 0 Ohio 122
- 3085 Ohio 122
- 3617 Garrett Dr
- 3138 Patrick Ct
- 3441 Madison Grace Way
- 3122 N State Route 741
- 3412 State Route 122
- 4196 Ohio 122
- 3142 Moyer Dr
- 3332 Moyer Dr
- 3140 Lynn Dr
- 3104 Lynn Dr
- 4468 Todd Rd
- 4480 State Route 123
- 4480 N St Rt 123
- 4641 Rose Marie Rd
- 3626 Colton Ct
- 0 Colton Ct Unit 1824949
- 2 Colton Ct
- 3200 Running Deer Trail
- Lot #95 Running Deer Trail
- Lot #90 Running Deer Trail
- 3484 Greycliff Ct
- 3204 Running Deer Trail
- 3480 Greycliff Ct
- 3480 Greycliff Ct
- 3195 Running Deer Trail
- 3191 Running Deer Trail
- 3483 Kestrel Ct
- 3201 Running Deer Trail
- 3187 Running Deer Trail
- 3208 Running Deer Trail
- 3485 Greycliff Ct
- 3476 Greycliff Ct
- 3501 Morning Dove Woods
- 3183 Running Deer Trail
- 51 Mourning Dove Woods
- Lot Mourning Dove Woods
- 52 Mourning Dove Woods