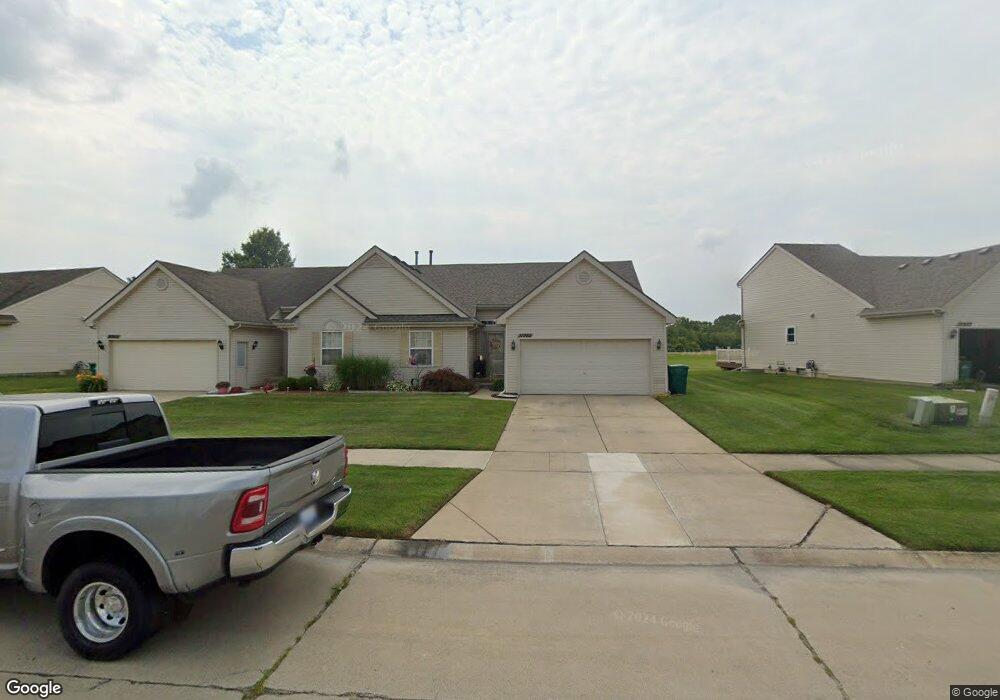
31965 Augusta Dr Unit 49 Romulus, MI 48174
Estimated Value: $220,000 - $284,000
2
Beds
3
Baths
1,224
Sq Ft
$207/Sq Ft
Est. Value
About This Home
This home is located at 31965 Augusta Dr Unit 49, Romulus, MI 48174 and is currently estimated at $253,418, approximately $207 per square foot. 31965 Augusta Dr Unit 49 is a home located in Wayne County with nearby schools including Romulus Elementary School, Romulus Middle School, and Romulus Senior High School.
Ownership History
Date
Name
Owned For
Owner Type
Purchase Details
Closed on
Mar 24, 2025
Sold by
Clark Antoinette and Clark-Schuster Antoinette
Bought by
Clark-Schuster Antoinette and Norman Osberita C
Current Estimated Value
Purchase Details
Closed on
Jan 18, 2023
Sold by
Clark Antoinette
Bought by
Norman Osberita C and Norman Anquinita C
Purchase Details
Closed on
Jul 23, 2010
Sold by
Nationstar Mortgage Llc
Bought by
Federal National Mortgage Association
Purchase Details
Closed on
Dec 16, 2009
Sold by
Atwal Maninder and Kaur Satinderjeet
Bought by
Nationstar Mortgage Llc
Purchase Details
Closed on
Oct 31, 2007
Sold by
Singh Ramesh and Singh Kunti
Bought by
Atwal Maninder
Purchase Details
Closed on
Oct 12, 2004
Sold by
Benivegna Building Co Inc
Bought by
Singh Ramesh
Create a Home Valuation Report for This Property
The Home Valuation Report is an in-depth analysis detailing your home's value as well as a comparison with similar homes in the area
Home Values in the Area
Average Home Value in this Area
Purchase History
| Date | Buyer | Sale Price | Title Company |
|---|---|---|---|
| Clark-Schuster Antoinette | -- | None Listed On Document | |
| Clark-Schuster Antoinette | -- | None Listed On Document | |
| Norman Osberita C | -- | Michigan Title Insurance Agenc | |
| Federal National Mortgage Association | -- | None Available | |
| Nationstar Mortgage Llc | $175,747 | None Available | |
| Atwal Maninder | $160,000 | Alpha Title Agency Inc | |
| Singh Ramesh | -- | Multiple |
Source: Public Records
Tax History
| Year | Tax Paid | Tax Assessment Tax Assessment Total Assessment is a certain percentage of the fair market value that is determined by local assessors to be the total taxable value of land and additions on the property. | Land | Improvement |
|---|---|---|---|---|
| 2025 | $1,582 | $109,700 | $0 | $0 |
| 2024 | $1,589 | $102,400 | $0 | $0 |
| 2023 | $1,529 | $95,000 | $0 | $0 |
| 2022 | $1,808 | $81,200 | $0 | $0 |
| 2021 | $1,747 | $71,700 | $0 | $0 |
| 2020 | $1,719 | $73,100 | $0 | $0 |
| 2019 | $1,717 | $67,500 | $0 | $0 |
| 2018 | $1,129 | $47,700 | $0 | $0 |
| 2017 | $831 | $47,300 | $0 | $0 |
| 2016 | $1,488 | $48,100 | $0 | $0 |
| 2015 | $2,859 | $39,100 | $0 | $0 |
| 2013 | $2,770 | $30,000 | $0 | $0 |
| 2012 | $877 | $29,500 | $5,000 | $24,500 |
Source: Public Records
Map
Nearby Homes
- 31665 Pine Valley Dr
- 31649 Augusta Dr Unit 67
- 31627 Augusta Dr Unit 68
- 5157 Niagara St
- 30905 Beverly Rd
- 5004 Hayes St
- 6851 Merriman Rd
- 4815 Mildred St
- 31711 Annapolis St
- 31707 Ecorse Rd
- 32515 Annapolis St
- 4523 Niagara St
- 000 Merriman
- 4214 Cadillac Ave
- 4060 Winifred St
- 34102 van Born Rd
- 6029 Edmund St
- 6015 Edmund St
- 7063 Sargent St
- 4948 Howe Rd
- 31953 Augusta Dr
- 31977 Augusta Dr
- 31941 Augusta Dr Unit 51
- 31999 Augusta Dr Unit 47
- 31929 Augusta Dr
- 31954 Augusta Dr
- 31966 Augusta Dr
- 32021 Augusta Dr
- 31978 Augusta Dr
- 31942 Augusta Dr Unit 24
- 32000 Augusta Dr
- 32000 Augusta Dr Unit 28
- 31930 Augusta Dr
- 31907 Augusta Dr Unit 53
- 32033 Augusta Dr
- 31908 Augusta Dr Unit 22
- 31855 Augusta Dr
- 31856 Augusta Dr
- 32034 Augusta Dr
- 32045 Augusta Dr
Your Personal Tour Guide
Ask me questions while you tour the home.