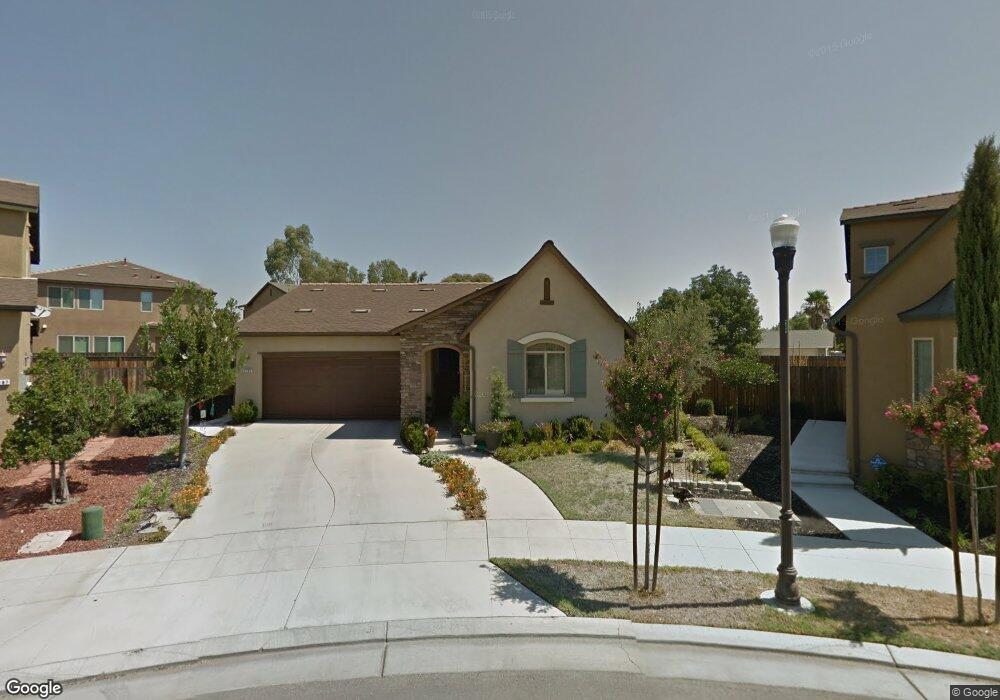
3197 Austin Ave Clovis, CA 93619
Estimated Value: $425,906 - $469,000
2
Beds
2
Baths
1,379
Sq Ft
$325/Sq Ft
Est. Value
About This Home
This home is located at 3197 Austin Ave, Clovis, CA 93619 and is currently estimated at $447,635, approximately $324 per square foot. 3197 Austin Ave is a home located in Fresno County with nearby schools including Freedom Elementary School, Reyburn Intermediate School, and Clovis East High School.
Ownership History
Date
Name
Owned For
Owner Type
Purchase Details
Closed on
Dec 10, 2014
Sold by
Worcester Susan V and Hunsbarger Susan V
Bought by
Worcester Susan and Susan V Worcester 2014 Revocable Family
Current Estimated Value
Purchase Details
Closed on
Jan 16, 2013
Sold by
Hunsbarger Richard T
Bought by
Hunsbarger Susan
Purchase Details
Closed on
Feb 14, 2012
Sold by
Hunsbarger Richard T and Hunsbarger Susan V
Bought by
Hunsbarger Richard T and Hunsbarger Susan
Purchase Details
Closed on
Sep 23, 2010
Sold by
Ashlan/Locan #1 Lp
Bought by
Hunsbarger Susan and Hunsbarger Richard
Home Financials for this Owner
Home Financials are based on the most recent Mortgage that was taken out on this home.
Original Mortgage
$175,912
Interest Rate
4.26%
Mortgage Type
New Conventional
Create a Home Valuation Report for This Property
The Home Valuation Report is an in-depth analysis detailing your home's value as well as a comparison with similar homes in the area
Purchase History
| Date | Buyer | Sale Price | Title Company |
|---|---|---|---|
| Worcester Susan | -- | None Available | |
| Hunsbarger Susan | -- | None Available | |
| Hunsbarger Richard T | -- | None Available | |
| Hunsbarger Richard T | -- | None Available | |
| Hunsbarger Richard T | -- | None Available | |
| Hunsbarger Susan | $220,000 | First American Title Company |
Source: Public Records
Mortgage History
| Date | Status | Borrower | Loan Amount |
|---|---|---|---|
| Closed | Hunsbarger Susan | $175,912 |
Source: Public Records
Tax History
| Year | Tax Paid | Tax Assessment Tax Assessment Total Assessment is a certain percentage of the fair market value that is determined by local assessors to be the total taxable value of land and additions on the property. | Land | Improvement |
|---|---|---|---|---|
| 2025 | $4,060 | $281,590 | $83,270 | $198,320 |
| 2023 | $3,911 | $270,658 | $80,038 | $190,620 |
| 2022 | $3,858 | $265,352 | $78,469 | $186,883 |
| 2021 | $3,763 | $260,150 | $76,931 | $183,219 |
| 2020 | $3,735 | $257,484 | $76,143 | $181,341 |
| 2019 | $3,664 | $252,436 | $74,650 | $177,786 |
| 2018 | $3,576 | $247,487 | $73,187 | $174,300 |
| 2017 | $3,522 | $242,635 | $71,752 | $170,883 |
| 2016 | $3,419 | $237,879 | $70,346 | $167,533 |
| 2015 | $3,368 | $234,307 | $69,290 | $165,017 |
| 2014 | $3,313 | $229,718 | $67,933 | $161,785 |
Source: Public Records
Map
Nearby Homes
- 3031 Glacier Ln
- 3357 Buckingham Ave
- 3350 Buckingham Ave
- 2914 Blackwood Ave
- 2885 Blackwood Ave
- 3046 Indianapolis Ave
- 2888 Ashcroft Ave
- 3001 Pico Ave
- 2735 Swift Ave
- 2836 Griffith Ave
- 7478 E Flint Way
- 2721 Holland Ave
- 3546 Saginaw Ave
- 7375 E Lansing Way
- 3698 Sussex Ave
- 7464 E Robinson Ave
- 2614 Indianapolis Ave
- 2722 Park Ave
- 2459 Lombard Ln
- 2449 Lombard Ln
- 3143 Maine Ave
- 3187 Austin Ave
- 3194 Swift Ave
- 3184 Swift Ave
- 3153 Maine Ave
- 3177 Austin Ave
- 3174 Swift Ave
- 3176 Austin Ave
- 3163 Maine Ave
- 3123 Maine Ave
- 3103 Maine Ave
- 3113 Maine Ave
- 3166 Austin Ave
- 3133 Maine Ave
- 3173 Maine Ave
- 3195 Swift Ave
- 3156 Austin Ave
- 3179 Antonio Ave
- 3175 Swift Ave
- 3183 Maine Ave
Your Personal Tour Guide
Ask me questions while you tour the home.