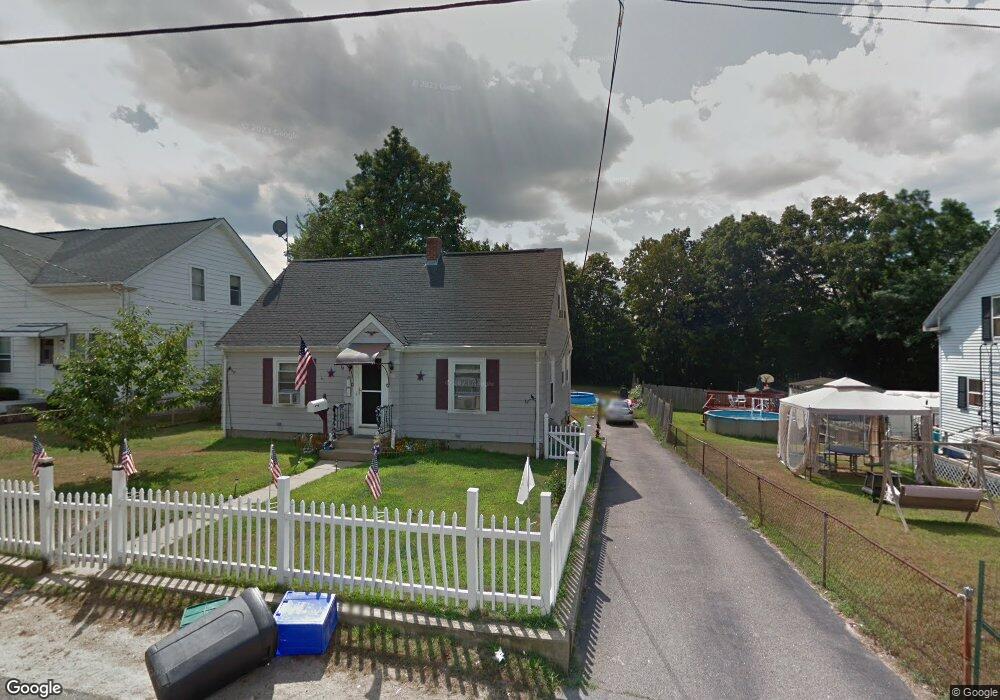
32 1/2 Parker St West Warwick, RI 02893
Lippitt-Harris NeighborhoodEstimated Value: $385,000 - $427,000
3
Beds
2
Baths
1,392
Sq Ft
$295/Sq Ft
Est. Value
About This Home
This home is located at 32 1/2 Parker St, West Warwick, RI 02893 and is currently estimated at $411,103, approximately $295 per square foot. 32 1/2 Parker St is a home located in Kent County with nearby schools including West Warwick High School and St Joseph School.
Ownership History
Date
Name
Owned For
Owner Type
Purchase Details
Closed on
Feb 28, 2020
Sold by
Defusco Ryan M and Horton Taylor A
Bought by
Flegle Fleagle J and Flegle Cynthia L
Current Estimated Value
Home Financials for this Owner
Home Financials are based on the most recent Mortgage that was taken out on this home.
Original Mortgage
$236,726
Outstanding Balance
$209,655
Interest Rate
3.5%
Mortgage Type
FHA
Estimated Equity
$201,448
Purchase Details
Closed on
Apr 13, 2015
Sold by
Kapre Llc
Bought by
Defusco Ryan M and Horton Taylor A
Home Financials for this Owner
Home Financials are based on the most recent Mortgage that was taken out on this home.
Original Mortgage
$168,150
Interest Rate
3.77%
Mortgage Type
New Conventional
Purchase Details
Closed on
Nov 21, 2014
Sold by
Sureka Anurag
Bought by
Pioneer Investments Llc
Purchase Details
Closed on
Sep 10, 2014
Sold by
Morequity Inc
Bought by
Kapre Llc
Purchase Details
Closed on
Feb 27, 2014
Sold by
Deutsche Bank Natl T C
Bought by
Pioneer Investments Ll
Home Financials for this Owner
Home Financials are based on the most recent Mortgage that was taken out on this home.
Original Mortgage
$100,000
Interest Rate
4.39%
Purchase Details
Closed on
Nov 26, 2013
Sold by
Knobel John A and Downey S&L Assoc
Bought by
Deutsche Bank Natl T C
Purchase Details
Closed on
May 26, 1995
Sold by
Theroux Odile
Bought by
Fleagle Fleagle J and Fleagle Cynthia
Create a Home Valuation Report for This Property
The Home Valuation Report is an in-depth analysis detailing your home's value as well as a comparison with similar homes in the area
Home Values in the Area
Average Home Value in this Area
Purchase History
| Date | Buyer | Sale Price | Title Company |
|---|---|---|---|
| Flegle Fleagle J | $244,900 | None Available | |
| Defusco Ryan M | $177,000 | -- | |
| Pioneer Investments Llc | -- | -- | |
| Kapre Llc | $81,900 | -- | |
| Pioneer Investments Ll | $95,358 | -- | |
| Deutsche Bank Natl T C | $145,200 | -- | |
| Fleagle Fleagle J | $80,000 | -- |
Source: Public Records
Mortgage History
| Date | Status | Borrower | Loan Amount |
|---|---|---|---|
| Open | Flegle Fleagle J | $236,726 | |
| Previous Owner | Fleagle Fleagle J | $168,150 | |
| Previous Owner | Fleagle Fleagle J | $100,000 | |
| Previous Owner | Fleagle Fleagle J | $187,000 |
Source: Public Records
Tax History Compared to Growth
Tax History
| Year | Tax Paid | Tax Assessment Tax Assessment Total Assessment is a certain percentage of the fair market value that is determined by local assessors to be the total taxable value of land and additions on the property. | Land | Improvement |
|---|---|---|---|---|
| 2025 | $4,591 | $321,300 | $96,000 | $225,300 |
| 2024 | $4,572 | $244,600 | $78,400 | $166,200 |
| 2023 | $4,481 | $244,600 | $78,400 | $166,200 |
| 2022 | $4,413 | $244,600 | $78,400 | $166,200 |
| 2021 | $4,807 | $209,000 | $65,900 | $143,100 |
| 2020 | $4,807 | $209,000 | $65,900 | $143,100 |
| 2019 | $6,128 | $209,000 | $65,900 | $143,100 |
| 2018 | $4,170 | $157,900 | $63,100 | $94,800 |
| 2017 | $4,154 | $157,900 | $63,100 | $94,800 |
| 2016 | $4,080 | $157,900 | $63,100 | $94,800 |
| 2015 | $3,598 | $138,600 | $63,100 | $75,500 |
| 2014 | $866 | $136,400 | $63,100 | $73,300 |
Source: Public Records
Map
Nearby Homes