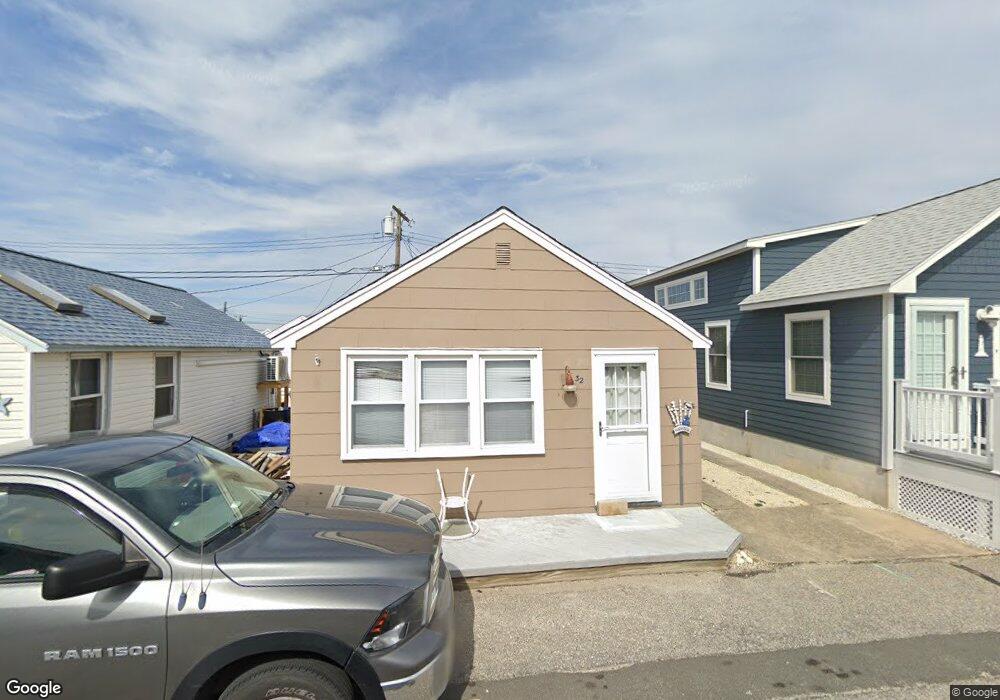
32 11th Ln Unit 300 Seaside Park, NJ 08752
Estimated Value: $511,000 - $661,000
2
Beds
2
Baths
633
Sq Ft
$915/Sq Ft
Est. Value
About This Home
This home is located at 32 11th Ln Unit 300, Seaside Park, NJ 08752 and is currently estimated at $579,086, approximately $914 per square foot. 32 11th Ln Unit 300 is a home located in Ocean County with nearby schools including Central Regional Middle School and Central Regional High School.
Ownership History
Date
Name
Owned For
Owner Type
Purchase Details
Closed on
Oct 21, 2025
Sold by
Truskolawski John
Bought by
Truskolawski John and Truskolawski Lisa
Current Estimated Value
Purchase Details
Closed on
Jun 30, 2022
Sold by
Valerie Truskolawski
Bought by
Truskolawski John
Purchase Details
Closed on
Aug 11, 1995
Sold by
Midway East
Bought by
Truskolawski Joseph and Truskolawski Valerie
Create a Home Valuation Report for This Property
The Home Valuation Report is an in-depth analysis detailing your home's value as well as a comparison with similar homes in the area
Home Values in the Area
Average Home Value in this Area
Purchase History
| Date | Buyer | Sale Price | Title Company |
|---|---|---|---|
| Truskolawski John | -- | None Listed On Document | |
| Truskolawski John | $463,000 | Jablonski Frank W | |
| Truskolawski John | $463,000 | None Listed On Document | |
| Truskolawski Joseph | $41,429 | -- |
Source: Public Records
Tax History Compared to Growth
Tax History
| Year | Tax Paid | Tax Assessment Tax Assessment Total Assessment is a certain percentage of the fair market value that is determined by local assessors to be the total taxable value of land and additions on the property. | Land | Improvement |
|---|---|---|---|---|
| 2025 | $7,293 | $302,500 | $258,000 | $44,500 |
| 2024 | $7,018 | $302,500 | $258,000 | $44,500 |
| 2023 | $6,888 | $302,500 | $258,000 | $44,500 |
| 2022 | $6,888 | $302,500 | $258,000 | $44,500 |
| 2021 | $6,743 | $302,500 | $258,000 | $44,500 |
| 2020 | $6,743 | $302,500 | $258,000 | $44,500 |
| 2019 | $6,555 | $302,500 | $258,000 | $44,500 |
| 2018 | $6,534 | $302,500 | $258,000 | $44,500 |
| 2017 | $6,292 | $302,500 | $258,000 | $44,500 |
| 2016 | $6,259 | $302,500 | $258,000 | $44,500 |
| 2015 | $6,086 | $302,500 | $258,000 | $44,500 |
| 2014 | $5,914 | $302,500 | $258,000 | $44,500 |
Source: Public Records
Map
Nearby Homes