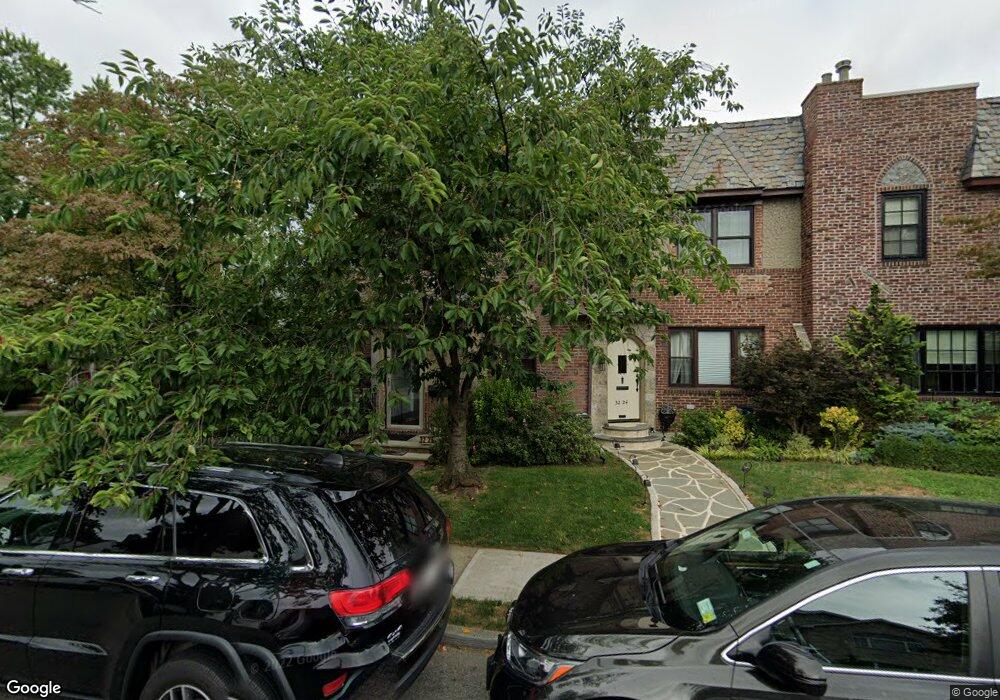
32-26 213th St Flushing, NY 11361
Bayside NeighborhoodEstimated Value: $1,072,000 - $1,325,000
3
Beds
3
Baths
1,464
Sq Ft
$823/Sq Ft
Est. Value
About This Home
This home is located at 32-26 213th St, Flushing, NY 11361 and is currently estimated at $1,204,778, approximately $822 per square foot. 32-26 213th St is a home located in Queens County with nearby schools including P.S. 41 - Crocheron, M.S. 158 - Marie Curie, and Bayside High School.
Ownership History
Date
Name
Owned For
Owner Type
Purchase Details
Closed on
Jun 19, 2008
Sold by
Kim Philip and Lee Jisu
Bought by
Hong Peter and Hong Sylvia
Current Estimated Value
Home Financials for this Owner
Home Financials are based on the most recent Mortgage that was taken out on this home.
Original Mortgage
$390,000
Outstanding Balance
$247,564
Interest Rate
6.01%
Mortgage Type
Purchase Money Mortgage
Estimated Equity
$957,214
Purchase Details
Closed on
May 26, 2005
Sold by
Kanevsky Viktor and Sitnitskaya Yekaterina
Bought by
Kim Philip and Lee Jisu
Home Financials for this Owner
Home Financials are based on the most recent Mortgage that was taken out on this home.
Original Mortgage
$560,000
Interest Rate
5.79%
Mortgage Type
Purchase Money Mortgage
Purchase Details
Closed on
Sep 20, 1996
Sold by
Medina Samuel G and Medina Paula Lee
Bought by
Kanevsky Viktor and Sitnitskaya Yekaterina
Home Financials for this Owner
Home Financials are based on the most recent Mortgage that was taken out on this home.
Original Mortgage
$103,130
Interest Rate
7.25%
Create a Home Valuation Report for This Property
The Home Valuation Report is an in-depth analysis detailing your home's value as well as a comparison with similar homes in the area
Home Values in the Area
Average Home Value in this Area
Purchase History
| Date | Buyer | Sale Price | Title Company |
|---|---|---|---|
| Hong Peter | $690,000 | -- | |
| Hong Peter | $690,000 | -- | |
| Kim Philip | $700,000 | -- | |
| Kim Philip | $700,000 | -- | |
| Kanevsky Viktor | $250,000 | Chicago Title Insurance Co | |
| Kanevsky Viktor | $250,000 | Chicago Title Insurance Co |
Source: Public Records
Mortgage History
| Date | Status | Borrower | Loan Amount |
|---|---|---|---|
| Open | Hong Peter | $390,000 | |
| Closed | Hong Peter | $390,000 | |
| Previous Owner | Kim Philip | $560,000 | |
| Previous Owner | Kanevsky Viktor | $103,130 |
Source: Public Records
Tax History
| Year | Tax Paid | Tax Assessment Tax Assessment Total Assessment is a certain percentage of the fair market value that is determined by local assessors to be the total taxable value of land and additions on the property. | Land | Improvement |
|---|---|---|---|---|
| 2025 | $8,549 | $43,316 | $7,809 | $35,507 |
| 2024 | $8,549 | $42,564 | $7,892 | $34,672 |
| 2023 | $8,117 | $40,415 | $7,557 | $32,858 |
| 2022 | $7,638 | $55,560 | $12,060 | $43,500 |
| 2021 | $7,305 | $59,100 | $12,060 | $47,040 |
| 2020 | $7,345 | $51,060 | $12,060 | $39,000 |
| 2019 | $7,127 | $52,080 | $12,060 | $40,020 |
| 2018 | $6,568 | $33,679 | $7,302 | $26,377 |
| 2017 | $6,200 | $31,886 | $8,113 | $23,773 |
| 2016 | $5,707 | $31,886 | $8,113 | $23,773 |
| 2015 | $3,408 | $30,081 | $9,077 | $21,004 |
| 2014 | $3,408 | $29,559 | $10,235 | $19,324 |
Source: Public Records
Map
Nearby Homes
- 33-03 213th St
- 2930 Bell Blvd
- 29-30 Bell Blvd
- 32-37 214th St
- 2914 Bell Blvd
- 210-30 29th Ave
- 2901 Bell Blvd
- 2835 Bell Blvd
- 211-22 34th Rd
- 28-18 211th St Unit 5A
- 34-08 210th St
- 2830 210th St
- 34-30 Corporal Kennedy St
- 33-15 208th St
- 209-25 28th Ave
- 32-12 208th St
- 34-26 209th St
- 32-03 Clearview Expy
- 2803 215th St
- 207-01 34th Ave
Your Personal Tour Guide
Ask me questions while you tour the home.