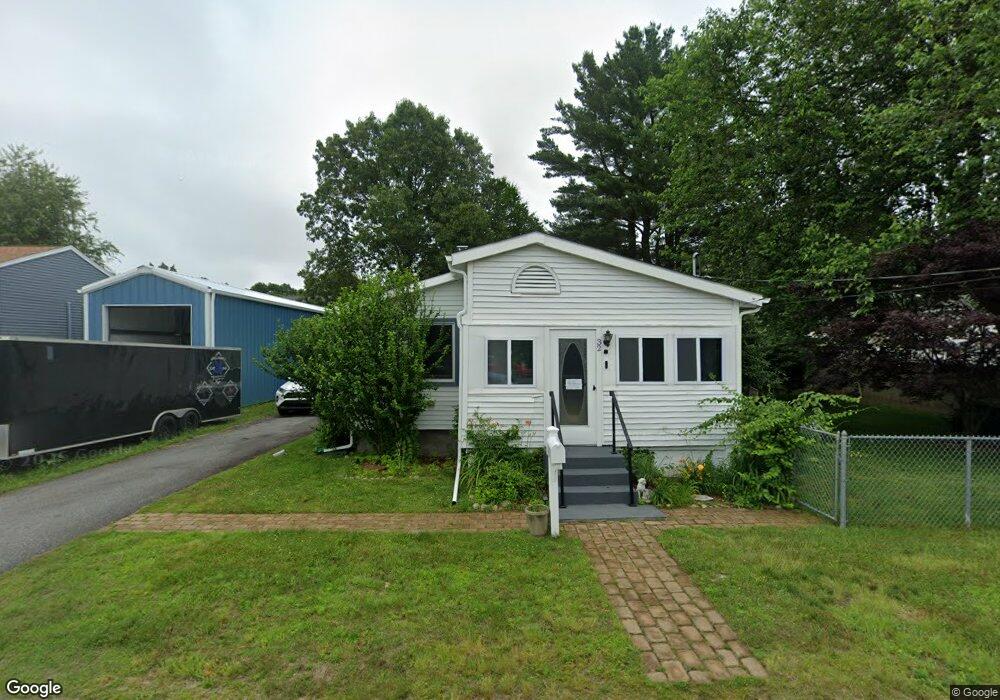
32 Aborn Ave Warwick, RI 02888
Palace Garden NeighborhoodEstimated Value: $301,000 - $388,000
2
Beds
1
Bath
955
Sq Ft
$378/Sq Ft
Est. Value
About This Home
This home is located at 32 Aborn Ave, Warwick, RI 02888 and is currently estimated at $360,656, approximately $377 per square foot. 32 Aborn Ave is a home located in Kent County with nearby schools including Saint Paul School and St. Peter School.
Ownership History
Date
Name
Owned For
Owner Type
Purchase Details
Closed on
Aug 14, 2020
Sold by
Napolillo Edward
Bought by
Gallant Maurice C and Gallant Gail E
Current Estimated Value
Purchase Details
Closed on
Jan 3, 2020
Sold by
Smith Burton
Bought by
Napolillo Edward
Purchase Details
Closed on
Sep 27, 1999
Sold by
Dorothy Willis L and Dorothy Sandra Herning
Bought by
Smith Burton
Home Financials for this Owner
Home Financials are based on the most recent Mortgage that was taken out on this home.
Original Mortgage
$63,900
Interest Rate
8.1%
Mortgage Type
Purchase Money Mortgage
Create a Home Valuation Report for This Property
The Home Valuation Report is an in-depth analysis detailing your home's value as well as a comparison with similar homes in the area
Home Values in the Area
Average Home Value in this Area
Purchase History
| Date | Buyer | Sale Price | Title Company |
|---|---|---|---|
| Gallant Maurice C | $249,000 | None Available | |
| Napolillo Edward | $70,000 | None Available | |
| Smith Burton | $71,000 | -- |
Source: Public Records
Mortgage History
| Date | Status | Borrower | Loan Amount |
|---|---|---|---|
| Previous Owner | Smith Burton | $92,000 | |
| Previous Owner | Smith Burton | $63,900 |
Source: Public Records
Tax History
| Year | Tax Paid | Tax Assessment Tax Assessment Total Assessment is a certain percentage of the fair market value that is determined by local assessors to be the total taxable value of land and additions on the property. | Land | Improvement |
|---|---|---|---|---|
| 2025 | $3,400 | $267,700 | $115,400 | $152,300 |
| 2024 | $3,189 | $220,400 | $100,300 | $120,100 |
| 2023 | $3,127 | $220,400 | $100,300 | $120,100 |
| 2022 | $2,941 | $157,000 | $65,200 | $91,800 |
| 2021 | $2,941 | $157,000 | $65,200 | $91,800 |
| 2020 | $2,941 | $157,000 | $65,200 | $91,800 |
| 2019 | $2,941 | $157,000 | $65,200 | $91,800 |
| 2018 | $2,708 | $133,800 | $65,200 | $68,600 |
| 2017 | $2,708 | $133,800 | $65,200 | $68,600 |
| 2016 | $2,708 | $133,800 | $65,200 | $68,600 |
| 2015 | $2,424 | $116,800 | $58,000 | $58,800 |
| 2014 | $2,343 | $116,800 | $58,000 | $58,800 |
| 2013 | $2,311 | $116,800 | $58,000 | $58,800 |
Source: Public Records
Map
Nearby Homes
- 33 Van Buren St
- 115 Irving Rd
- 526 Post Rd
- 73 Byron Blvd
- 200 Post Rd Unit 419
- 190 Wendell Rd
- 6 Tennyson Rd
- 28 Rosegarden St
- 111 Beechcrest St
- 15 Palm Blvd N
- 21 Madison St
- 111 Roger Williams Cir
- 56 Errol St
- 55 Mayflower Dr
- 127 Sherwood Ave
- 111 Sherwood Ave
- 171 Sherwood Ave
- 136 Sherwood Ave
- 31 Denver Ave
- 0 Remington St
Your Personal Tour Guide
Ask me questions while you tour the home.