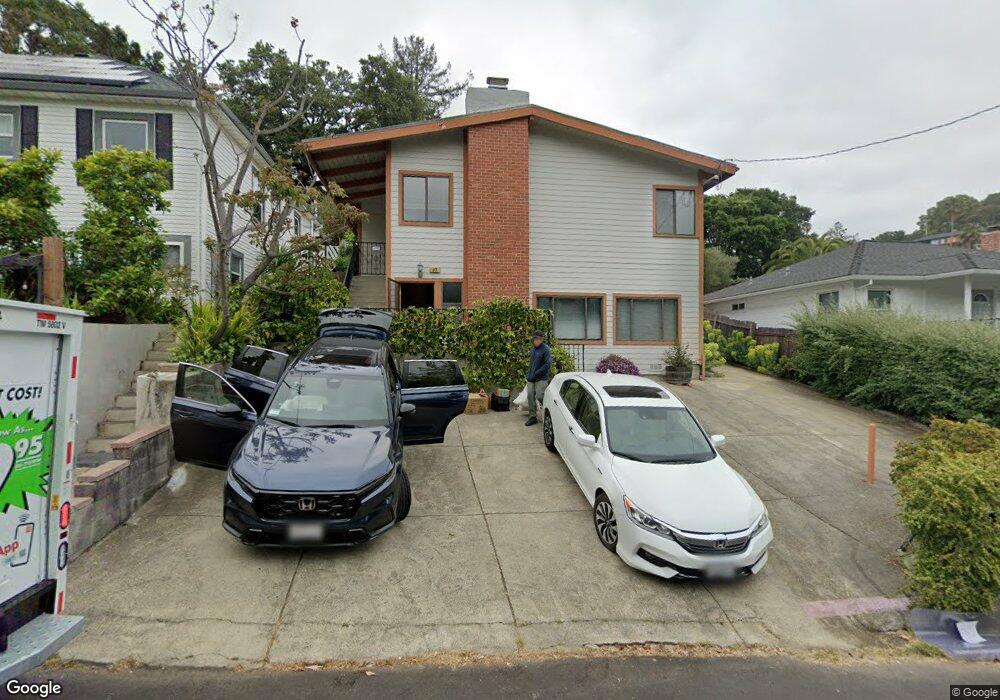
32 Alexander Ave San Rafael, CA 94901
Gerstle Park NeighborhoodEstimated Value: $1,100,000 - $1,259,000
3
Beds
2
Baths
2,069
Sq Ft
$574/Sq Ft
Est. Value
About This Home
This home is located at 32 Alexander Ave, San Rafael, CA 94901 and is currently estimated at $1,188,109, approximately $574 per square foot. 32 Alexander Ave is a home located in Marin County with nearby schools including Sun Valley Elementary School, James B. Davidson Middle School, and San Rafael High School.
Ownership History
Date
Name
Owned For
Owner Type
Purchase Details
Closed on
Jun 7, 2013
Sold by
Tong Jason Wai Ho and Tong Mitchell Hing Chor
Bought by
Deal Jason
Current Estimated Value
Home Financials for this Owner
Home Financials are based on the most recent Mortgage that was taken out on this home.
Original Mortgage
$329,000
Outstanding Balance
$231,449
Interest Rate
3.32%
Mortgage Type
New Conventional
Estimated Equity
$956,660
Purchase Details
Closed on
Sep 30, 2009
Sold by
Tong Jason Wai Ho
Bought by
Tong Jason Wai Ho and Tong Mitchell Hing Chor
Purchase Details
Closed on
Apr 8, 2003
Sold by
32 Alexander Holding Trust and Tong Yok Ying
Bought by
32 Alexander Holding Trust and Tong Jason W
Purchase Details
Closed on
Dec 10, 2002
Sold by
Tong Mitchell Hing Chor and Tong Anna So Hing
Bought by
32 Alexander Holding Trust and Tong Yok Ying
Purchase Details
Closed on
Oct 10, 1993
Sold by
Tong Mitchell Hing Chor and Tong Anna So Hing
Bought by
Tong Mitchell Hing Chor and Tong Anna So Hing
Create a Home Valuation Report for This Property
The Home Valuation Report is an in-depth analysis detailing your home's value as well as a comparison with similar homes in the area
Home Values in the Area
Average Home Value in this Area
Purchase History
| Date | Buyer | Sale Price | Title Company |
|---|---|---|---|
| Deal Jason | $629,000 | Fidelity National Title Co | |
| Deal Jason | -- | Fidelity National Title Co | |
| Tong Jason Wai Ho | -- | None Available | |
| 32 Alexander Holding Trust | -- | -- | |
| 32 Alexander Holding Trust | -- | -- | |
| Tong Mitchell Hing Chor | -- | -- | |
| Tong Mitchell Hing Chor | -- | -- |
Source: Public Records
Mortgage History
| Date | Status | Borrower | Loan Amount |
|---|---|---|---|
| Open | Deal Jason | $329,000 |
Source: Public Records
Tax History
| Year | Tax Paid | Tax Assessment Tax Assessment Total Assessment is a certain percentage of the fair market value that is determined by local assessors to be the total taxable value of land and additions on the property. | Land | Improvement |
|---|---|---|---|---|
| 2025 | $11,800 | $772,075 | $492,552 | $279,523 |
| 2024 | $11,245 | $756,939 | $482,896 | $274,043 |
| 2023 | $11,031 | $742,098 | $473,428 | $268,670 |
| 2022 | $10,447 | $727,551 | $464,148 | $263,403 |
| 2021 | $10,281 | $713,287 | $455,048 | $258,239 |
| 2020 | $10,167 | $705,976 | $450,384 | $255,592 |
| 2019 | $9,765 | $692,139 | $441,556 | $250,583 |
| 2018 | $9,668 | $678,570 | $432,900 | $245,670 |
| 2017 | $9,308 | $665,265 | $424,412 | $240,853 |
| 2016 | $8,994 | $652,224 | $416,092 | $236,132 |
| 2015 | $8,597 | $642,430 | $409,844 | $232,586 |
| 2014 | $8,239 | $629,846 | $401,816 | $228,030 |
Source: Public Records
Map
Nearby Homes
- 30 Alexander Ave
- 38 Alexander Ave
- 24 Alexander Ave
- 40 Alexander Ave
- 18 Belloreid Ave
- 22 Alexander Ave
- 42 Alexander Ave
- 9 Belloreid Ave
- 14 Belloreid Ave
- 20 Alexander Ave
- 46 Alexander Ave
- 10 Belloreid Ave
- 48 Alexander Ave
- 16 Alexander Ave
- 2130 4th St
- 2138 4th St
- 50 Alexander Ave Unit A / B
- 50 Alexander Ave
- 75 E Crescent Dr
- 58 W Crescent Dr
Your Personal Tour Guide
Ask me questions while you tour the home.