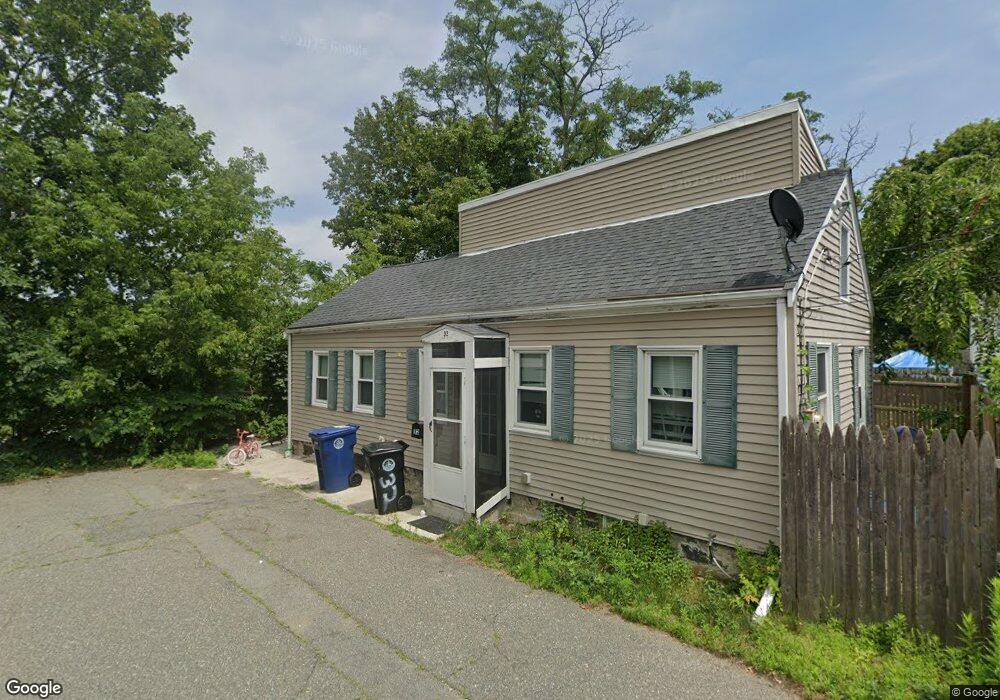
32 Beaver St Unit 1 Salem, MA 01970
Gallows Hill NeighborhoodEstimated Value: $476,000 - $566,000
3
Beds
1
Bath
1,200
Sq Ft
$430/Sq Ft
Est. Value
About This Home
This home is located at 32 Beaver St Unit 1, Salem, MA 01970 and is currently estimated at $515,849, approximately $429 per square foot. 32 Beaver St Unit 1 is a home located in Essex County with nearby schools including Witchcraft Heights Elementary School, Bates Elementary School, and Horace Mann Laboratory.
Ownership History
Date
Name
Owned For
Owner Type
Purchase Details
Closed on
Apr 23, 2018
Sold by
Lawson Bruce M and Lawson Jane A
Bought by
32 Beaver Street Rt
Current Estimated Value
Purchase Details
Closed on
Aug 29, 2006
Sold by
Deutsche Bank Natl T C
Bought by
Lawson Bruce M
Purchase Details
Closed on
Feb 10, 2006
Sold by
Linehan Melanie and Linehan Mark E
Bought by
Deutsche Bk Natl T Co
Create a Home Valuation Report for This Property
The Home Valuation Report is an in-depth analysis detailing your home's value as well as a comparison with similar homes in the area
Home Values in the Area
Average Home Value in this Area
Purchase History
| Date | Buyer | Sale Price | Title Company |
|---|---|---|---|
| 32 Beaver Street Rt | -- | -- | |
| Lawson Bruce M | $160,000 | -- | |
| Deutsche Bk Natl T Co | $195,093 | -- |
Source: Public Records
Mortgage History
| Date | Status | Borrower | Loan Amount |
|---|---|---|---|
| Previous Owner | Deutsche Bk Natl T Co | $213,750 | |
| Previous Owner | Deutsche Bk Natl T Co | $187,500 |
Source: Public Records
Tax History Compared to Growth
Tax History
| Year | Tax Paid | Tax Assessment Tax Assessment Total Assessment is a certain percentage of the fair market value that is determined by local assessors to be the total taxable value of land and additions on the property. | Land | Improvement |
|---|---|---|---|---|
| 2025 | $4,624 | $407,800 | $153,100 | $254,700 |
| 2024 | $4,471 | $384,800 | $145,000 | $239,800 |
| 2023 | $4,300 | $343,700 | $134,300 | $209,400 |
| 2022 | $4,195 | $316,600 | $126,200 | $190,400 |
| 2021 | $4,249 | $307,900 | $126,200 | $181,700 |
| 2020 | $3,946 | $273,100 | $109,000 | $164,100 |
| 2019 | $3,926 | $260,000 | $103,700 | $156,300 |
| 2018 | $3,807 | $247,500 | $98,800 | $148,700 |
| 2017 | $3,499 | $220,600 | $80,600 | $140,000 |
| 2016 | $3,389 | $216,300 | $76,300 | $140,000 |
| 2015 | $3,282 | $200,000 | $68,800 | $131,200 |
Source: Public Records
Map
Nearby Homes
- 128 Boston St Unit 4
- 145 Boston St
- 55 Butler St
- 97 Mason St Unit 2
- 15 Wall St
- 36 Summit St
- 23 Proctor St
- 36 Irving St Unit B
- 57 Ord St
- 145 Federal St Unit 3
- 35 Flint St Unit 209
- 35 Flint St Unit 106
- 2 Hillside Ave
- 38 Chestnut St
- 2 Osborne St
- 19 Cushing St
- 46 Walnut St
- 3 S Mason St
- 10 Elliott Place Unit 1R
- 78 Federal St