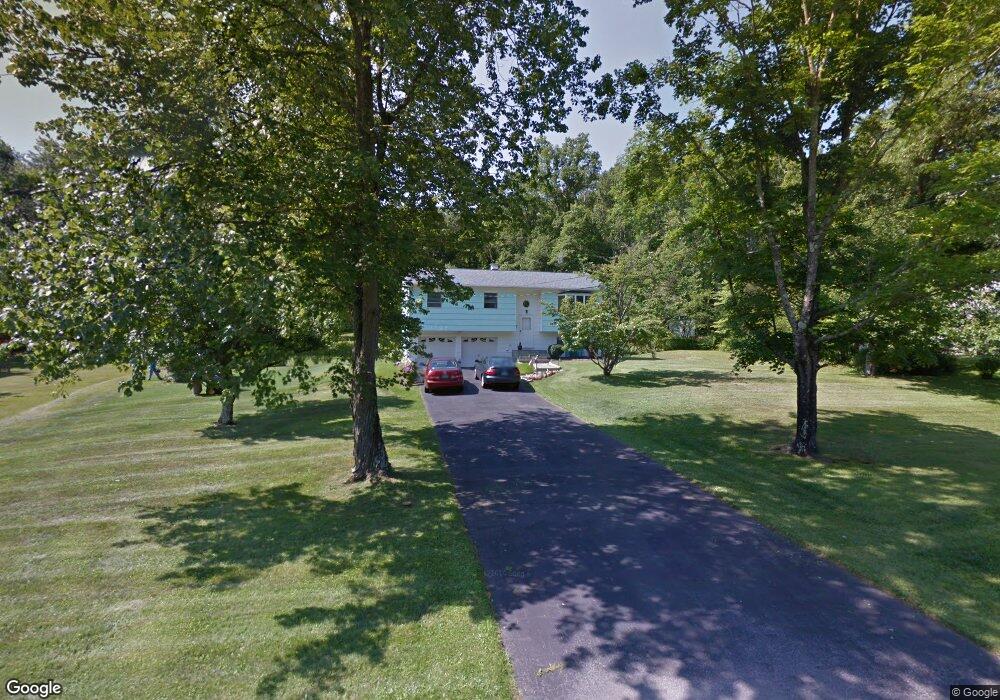
32 Benson Dr Danbury, CT 06810
Estimated Value: $414,000 - $589,000
3
Beds
1
Bath
1,132
Sq Ft
$437/Sq Ft
Est. Value
About This Home
This home is located at 32 Benson Dr, Danbury, CT 06810 and is currently estimated at $494,666, approximately $436 per square foot. 32 Benson Dr is a home located in Fairfield County with nearby schools including Mill Ridge Primary School, Rogers Park Middle School, and Danbury High School.
Ownership History
Date
Name
Owned For
Owner Type
Purchase Details
Closed on
Oct 11, 2011
Sold by
Pando Richard A and Pando Kathleen A
Bought by
Marsini Maurice A and Marsini Marisa B
Current Estimated Value
Home Financials for this Owner
Home Financials are based on the most recent Mortgage that was taken out on this home.
Original Mortgage
$314,324
Interest Rate
3.9%
Mortgage Type
FHA
Create a Home Valuation Report for This Property
The Home Valuation Report is an in-depth analysis detailing your home's value as well as a comparison with similar homes in the area
Home Values in the Area
Average Home Value in this Area
Purchase History
| Date | Buyer | Sale Price | Title Company |
|---|---|---|---|
| Marsini Maurice A | $322,500 | -- |
Source: Public Records
Mortgage History
| Date | Status | Borrower | Loan Amount |
|---|---|---|---|
| Closed | Marsini Maurice A | $314,324 | |
| Previous Owner | Marsini Maurice A | $18,000 |
Source: Public Records
Tax History Compared to Growth
Tax History
| Year | Tax Paid | Tax Assessment Tax Assessment Total Assessment is a certain percentage of the fair market value that is determined by local assessors to be the total taxable value of land and additions on the property. | Land | Improvement |
|---|---|---|---|---|
| 2025 | $6,067 | $242,760 | $95,620 | $147,140 |
| 2024 | $5,933 | $242,760 | $95,620 | $147,140 |
| 2023 | $5,664 | $242,760 | $95,620 | $147,140 |
| 2022 | $5,478 | $194,100 | $92,500 | $101,600 |
| 2021 | $5,357 | $194,100 | $92,500 | $101,600 |
| 2020 | $5,357 | $194,100 | $92,500 | $101,600 |
| 2019 | $5,357 | $194,100 | $92,500 | $101,600 |
| 2018 | $5,357 | $194,100 | $92,500 | $101,600 |
| 2017 | $5,312 | $183,500 | $88,100 | $95,400 |
| 2016 | $5,263 | $183,500 | $88,100 | $95,400 |
| 2015 | $5,186 | $183,500 | $88,100 | $95,400 |
| 2014 | $5,065 | $183,500 | $88,100 | $95,400 |
Source: Public Records
Map
Nearby Homes
- 4 Union Cir
- 1022 Country View Rd Unit 1022
- 7 Foxwood Dr
- 5 Foxwood Dr
- 5 Foxwood Dr Unit Lot 58
- 7 Foxwood Dr Unit Lot 57
- Mohonk Elite Plan at Rivington - The Meadows
- Albrecht Plan at Rivington - The Meadows
- Mohonk Plan at Rivington - The Meadows
- Hawthorne Plan at Rivington - The Meadows
- 5 Thorncrest Ridge
- Winwood Plan at Rivington - Regency
- Jaywick Plan at Rivington - Regency
- Aberton Plan at Rivington - Regency
- Jaffrey Plan at Rivington - Regency
- Alstead Plan at Rivington - Regency
- 5 Thorncrest Ridge Unit Lot 54
- 3 Thorncrest Ridge Unit Lot 55
- 1 Thorncrest Ridge Unit Lot 56
- 7 Thorncrest Ridge Unit Lot 53