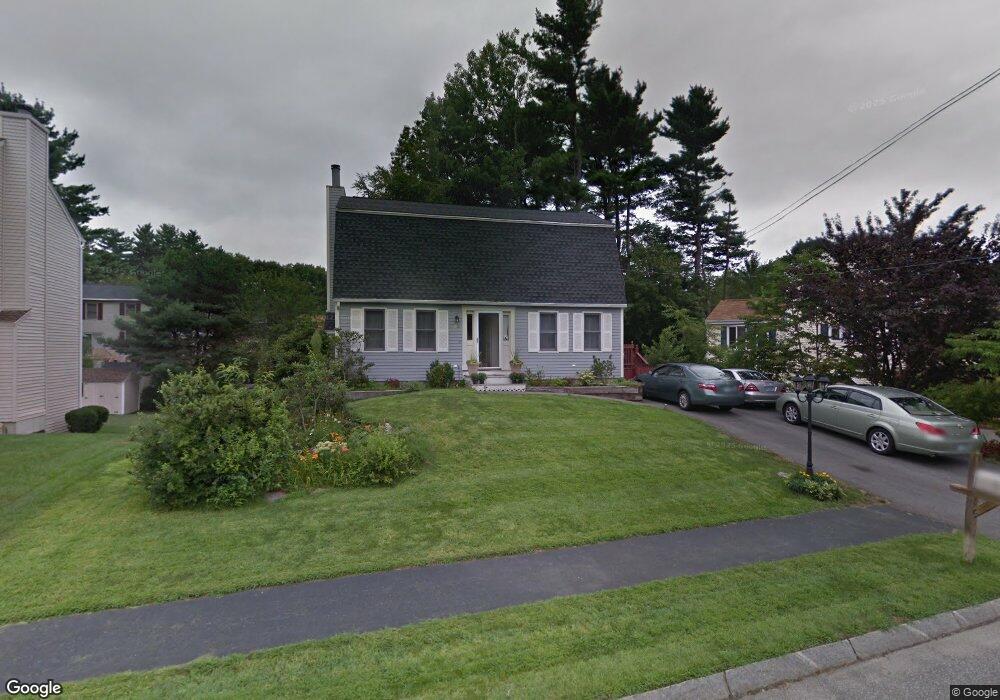
32 Brinton Dr Nashua, NH 03064
Northeast Nashua NeighborhoodEstimated Value: $531,000 - $605,000
3
Beds
3
Baths
2,256
Sq Ft
$251/Sq Ft
Est. Value
About This Home
This home is located at 32 Brinton Dr, Nashua, NH 03064 and is currently estimated at $565,475, approximately $250 per square foot. 32 Brinton Dr is a home located in Hillsborough County with nearby schools including Charlotte Ave Elementary School, Pennichuck Middle School, and Nashua High School North.
Ownership History
Date
Name
Owned For
Owner Type
Purchase Details
Closed on
May 19, 2010
Sold by
Cass Derek L and Cass Cindy
Bought by
Shooni Karen
Current Estimated Value
Home Financials for this Owner
Home Financials are based on the most recent Mortgage that was taken out on this home.
Original Mortgage
$205,000
Outstanding Balance
$137,556
Interest Rate
5.23%
Mortgage Type
Purchase Money Mortgage
Estimated Equity
$427,919
Purchase Details
Closed on
May 15, 2003
Sold by
Dupree Jonathan C and Dupree Elizabeth S
Bought by
Cass Derek L
Purchase Details
Closed on
Apr 9, 2001
Sold by
Lucier Todd R and Lucier Theresa A
Bought by
Dupree Jonathan C and Dupree Elizabeth S
Create a Home Valuation Report for This Property
The Home Valuation Report is an in-depth analysis detailing your home's value as well as a comparison with similar homes in the area
Home Values in the Area
Average Home Value in this Area
Purchase History
| Date | Buyer | Sale Price | Title Company |
|---|---|---|---|
| Shooni Karen | $262,000 | -- | |
| Cass Derek L | $237,000 | -- | |
| Dupree Jonathan C | $178,900 | -- |
Source: Public Records
Mortgage History
| Date | Status | Borrower | Loan Amount |
|---|---|---|---|
| Open | Dupree Jonathan C | $205,000 | |
| Previous Owner | Dupree Jonathan C | $80,000 | |
| Previous Owner | Dupree Jonathan C | $40,000 |
Source: Public Records
Tax History Compared to Growth
Tax History
| Year | Tax Paid | Tax Assessment Tax Assessment Total Assessment is a certain percentage of the fair market value that is determined by local assessors to be the total taxable value of land and additions on the property. | Land | Improvement |
|---|---|---|---|---|
| 2024 | $7,850 | $493,700 | $155,100 | $338,600 |
| 2023 | $7,389 | $405,300 | $124,100 | $281,200 |
| 2022 | $7,324 | $405,300 | $124,100 | $281,200 |
| 2021 | $6,659 | $286,800 | $86,900 | $199,900 |
| 2020 | $6,485 | $286,800 | $86,900 | $199,900 |
| 2019 | $6,241 | $286,800 | $86,900 | $199,900 |
| 2018 | $6,083 | $286,800 | $86,900 | $199,900 |
| 2017 | $6,166 | $239,100 | $67,200 | $171,900 |
| 2016 | $5,994 | $239,100 | $67,200 | $171,900 |
| 2015 | $5,865 | $239,100 | $67,200 | $171,900 |
| 2014 | $5,750 | $239,100 | $67,200 | $171,900 |
Source: Public Records
Map
Nearby Homes
- 11 Merrimack Dr Unit 121
- 11 Merrimack Dr
- 28 Merrimack Dr
- 40 Merrimack Dr
- 9 Elystan Cir
- 16 Cassandra Ln
- 18 Swift Ln
- 9 Plaza Ave
- 36 Charles Bancroft Hwy
- 113 Concord St
- 47 Hanna Cir Unit 47
- 47 Hanna Cir
- 11 Bradford Ln
- 12 Leclair Dr
- 5 Shoreline Dr Unit 14
- 7 Shoreline Dr Unit 13
- 1 Shoreline Dr Unit 16
- 11 Juliana Ave Unit 52
- 19 Bartlett Ave
- 17 Danbury Rd