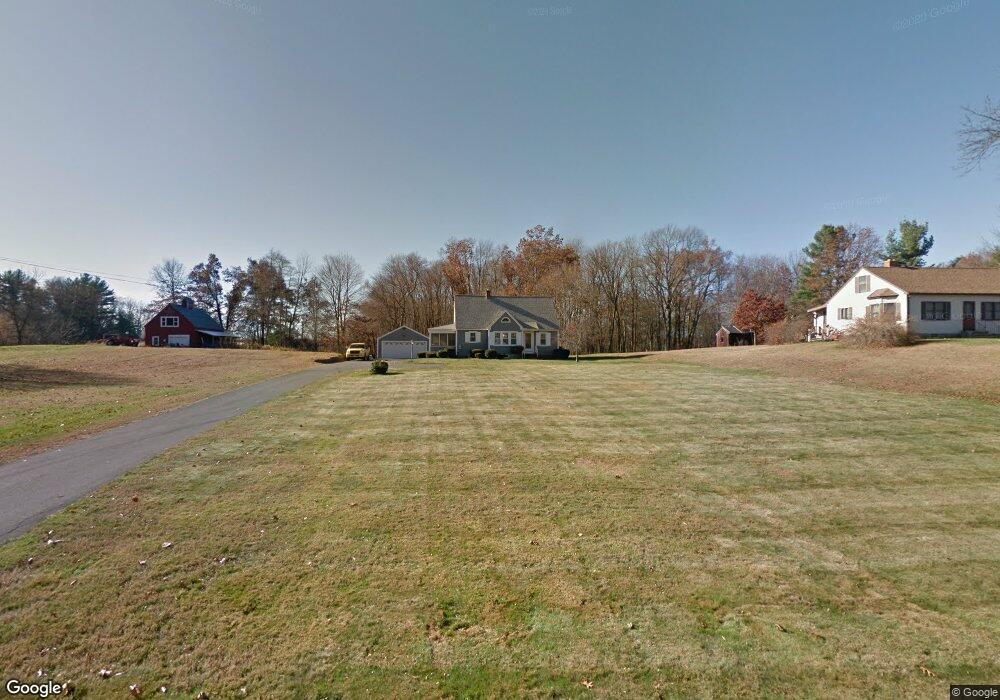
32 Brook St Easthampton, MA 01027
Estimated Value: $383,000 - $495,000
3
Beds
2
Baths
1,418
Sq Ft
$314/Sq Ft
Est. Value
About This Home
This home is located at 32 Brook St, Easthampton, MA 01027 and is currently estimated at $445,633, approximately $314 per square foot. 32 Brook St is a home located in Hampshire County with nearby schools including Easthampton High School, Tri-County Schools, and New England Adolescent Research Institute.
Ownership History
Date
Name
Owned For
Owner Type
Purchase Details
Closed on
Dec 6, 2013
Sold by
Tremblay Gloria F and Burgielewicz Eugene F
Bought by
Obrien Shawn and Obrien Ashley D
Current Estimated Value
Home Financials for this Owner
Home Financials are based on the most recent Mortgage that was taken out on this home.
Original Mortgage
$211,200
Outstanding Balance
$160,380
Interest Rate
4.17%
Mortgage Type
New Conventional
Estimated Equity
$285,253
Create a Home Valuation Report for This Property
The Home Valuation Report is an in-depth analysis detailing your home's value as well as a comparison with similar homes in the area
Home Values in the Area
Average Home Value in this Area
Purchase History
| Date | Buyer | Sale Price | Title Company |
|---|---|---|---|
| Obrien Shawn | $264,000 | -- | |
| Obrien Shawn | $264,000 | -- |
Source: Public Records
Mortgage History
| Date | Status | Borrower | Loan Amount |
|---|---|---|---|
| Open | Obrien Shawn | $211,200 | |
| Closed | Obrien Shawn | $211,200 |
Source: Public Records
Tax History
| Year | Tax Paid | Tax Assessment Tax Assessment Total Assessment is a certain percentage of the fair market value that is determined by local assessors to be the total taxable value of land and additions on the property. | Land | Improvement |
|---|---|---|---|---|
| 2025 | $5,344 | $390,900 | $139,900 | $251,000 |
| 2024 | $5,161 | $380,600 | $135,800 | $244,800 |
| 2023 | $3,961 | $270,400 | $108,100 | $162,300 |
| 2022 | $4,470 | $270,400 | $108,100 | $162,300 |
| 2021 | $4,908 | $279,800 | $108,100 | $171,700 |
| 2020 | $4,802 | $270,400 | $108,100 | $162,300 |
| 2019 | $4,037 | $261,100 | $108,100 | $153,000 |
| 2018 | $3,902 | $243,900 | $101,800 | $142,100 |
| 2017 | $3,813 | $235,200 | $97,800 | $137,400 |
| 2016 | $3,692 | $236,800 | $97,800 | $139,000 |
| 2015 | $3,588 | $236,800 | $97,800 | $139,000 |
Source: Public Records
Map
Nearby Homes
- 36 & 36R Holly Cir
- 4 Laurel Dr
- 29 Sandra Rd
- 2 W Park Dr
- 245 Park St
- 6 S St & Abutting Lots
- 19 Mount Tom Ave Unit 19
- 1 Plain St
- 41 South St Unit 11
- 36 Line St
- 95 Gunn Rd
- 2 Oak St
- 19 Nicols Way Unit 19
- 33 Knipfer Ave
- 385 Main St
- 7 Western View Rd
- M143 &152 Glendale St
- 12 Glen Cove Place Unit B
- 10 Glen Cove Place Unit A
- 38 College Hwy
Your Personal Tour Guide
Ask me questions while you tour the home.