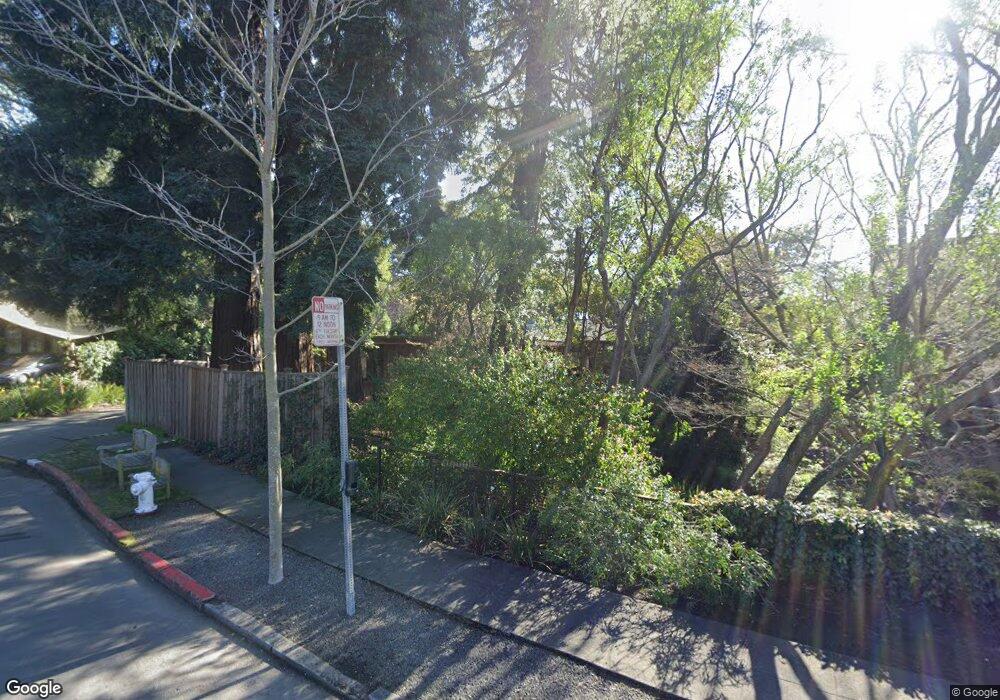
32 Brookside Ave Berkeley, CA 94705
Claremont NeighborhoodEstimated Value: $2,052,069 - $2,311,000
3
Beds
3
Baths
1,882
Sq Ft
$1,154/Sq Ft
Est. Value
About This Home
This home is located at 32 Brookside Ave, Berkeley, CA 94705 and is currently estimated at $2,172,017, approximately $1,154 per square foot. 32 Brookside Ave is a home located in Alameda County with nearby schools including John Muir Elementary School, Emerson Elementary School, and Malcolm X Elementary School.
Ownership History
Date
Name
Owned For
Owner Type
Purchase Details
Closed on
Feb 4, 2009
Sold by
Lum Helen L and Lum Revocable Trust
Bought by
Lum Helen L and Lum Baron B
Current Estimated Value
Purchase Details
Closed on
Aug 27, 1996
Sold by
Lum Yuen H and Lum Helen L
Bought by
Lum Yuen H and Lum Helen L
Purchase Details
Closed on
Jul 18, 1994
Sold by
Drapkin Sara
Bought by
Lum Yuen H and Lum Helen L
Home Financials for this Owner
Home Financials are based on the most recent Mortgage that was taken out on this home.
Original Mortgage
$384,800
Interest Rate
8.38%
Create a Home Valuation Report for This Property
The Home Valuation Report is an in-depth analysis detailing your home's value as well as a comparison with similar homes in the area
Home Values in the Area
Average Home Value in this Area
Purchase History
| Date | Buyer | Sale Price | Title Company |
|---|---|---|---|
| Lum Helen L | -- | None Available | |
| Lum Yuen H | -- | -- | |
| Lum Yuen H | $481,000 | Placer Title Company |
Source: Public Records
Mortgage History
| Date | Status | Borrower | Loan Amount |
|---|---|---|---|
| Previous Owner | Lum Yuen H | $384,800 |
Source: Public Records
Tax History
| Year | Tax Paid | Tax Assessment Tax Assessment Total Assessment is a certain percentage of the fair market value that is determined by local assessors to be the total taxable value of land and additions on the property. | Land | Improvement |
|---|---|---|---|---|
| 2025 | $14,116 | $800,891 | $242,367 | $565,524 |
| 2024 | $14,116 | $785,052 | $237,615 | $554,437 |
| 2023 | $13,732 | $776,525 | $232,957 | $543,568 |
| 2022 | $13,379 | $754,301 | $228,390 | $532,911 |
| 2021 | $13,382 | $739,377 | $223,913 | $522,464 |
| 2020 | $12,628 | $738,724 | $221,617 | $517,107 |
| 2019 | $12,082 | $724,241 | $217,272 | $506,969 |
| 2018 | $11,845 | $710,041 | $213,012 | $497,029 |
| 2017 | $11,420 | $696,121 | $208,836 | $487,285 |
| 2016 | $11,010 | $682,475 | $204,742 | $477,733 |
| 2015 | $10,845 | $672,225 | $201,667 | $470,558 |
| 2014 | $10,518 | $659,060 | $197,718 | $461,342 |
Source: Public Records
Map
Nearby Homes
- 6100 Chabot Rd
- 5941 Keith Ave
- 2477 Prince St
- 5936 Broadway
- 6446 Colby St
- 204 El Camino Real
- 2935 Florence St
- 5466 Shafter Ave
- 1488 Alvarado Rd
- 5668 Buena Vista Ave
- 6445 Irwin Ct
- 0 Tunnel Rd
- 2243 Ashby Ave
- 287 Cross Rd
- 362 Hudson St
- 2632 Warring St Unit 3
- 260 Alvarado Rd
- 0 Gravatt Dr Unit 41122154
- 629 66th St
- 5360 Boyd Ave
Your Personal Tour Guide
Ask me questions while you tour the home.
