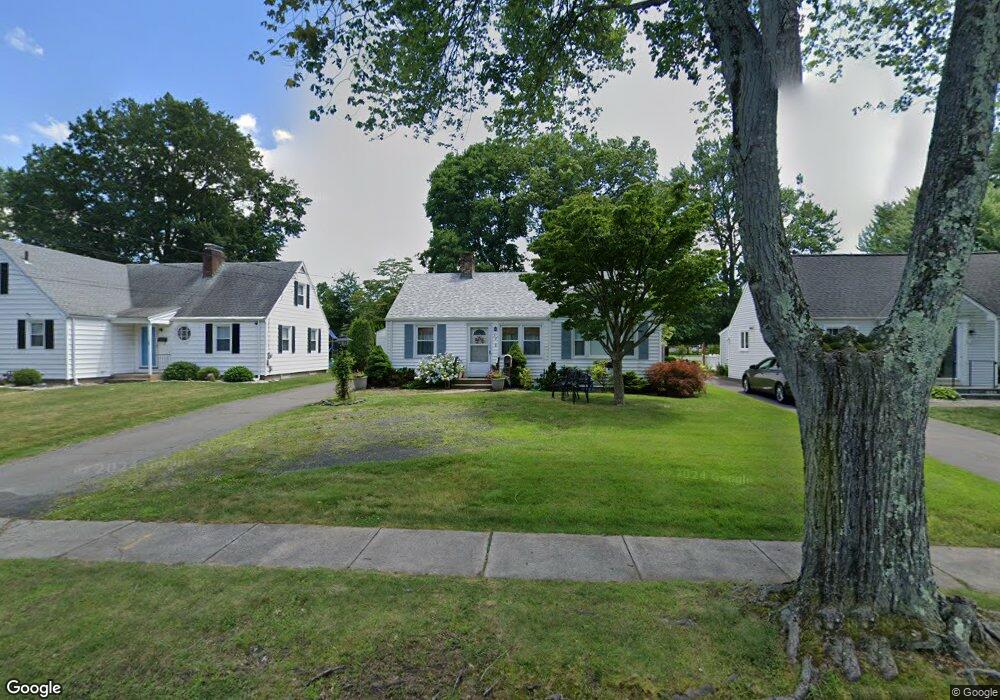
32 Bunce Rd Wethersfield, CT 06109
Estimated Value: $345,757 - $368,000
3
Beds
1
Bath
1,165
Sq Ft
$307/Sq Ft
Est. Value
About This Home
This home is located at 32 Bunce Rd, Wethersfield, CT 06109 and is currently estimated at $357,189, approximately $306 per square foot. 32 Bunce Rd is a home located in Hartford County with nearby schools including Emerson-Williams School, Silas Deane Middle School, and Wethersfield High School.
Ownership History
Date
Name
Owned For
Owner Type
Purchase Details
Closed on
Jun 2, 2008
Sold by
Iola B Johnston Ft and Johnston
Bought by
Salemi Vincent and Salemi Janet M
Current Estimated Value
Home Financials for this Owner
Home Financials are based on the most recent Mortgage that was taken out on this home.
Original Mortgage
$126,875
Interest Rate
5.91%
Mortgage Type
Purchase Money Mortgage
Purchase Details
Closed on
Aug 17, 2005
Sold by
Jar Thomas P K
Bought by
Iola B Johnston Ft and Johnston Iola B
Create a Home Valuation Report for This Property
The Home Valuation Report is an in-depth analysis detailing your home's value as well as a comparison with similar homes in the area
Home Values in the Area
Average Home Value in this Area
Purchase History
We collect this data history from publicly available records. To have your information removed, we recommend requesting removal directly through your county’s website.
| Date | Buyer | Sale Price | Title Company |
|---|---|---|---|
| Salemi Vincent | $219,000 | -- | |
| Iola B Johnston Ft | $227,500 | -- |
Source: Public Records
Mortgage History
We collect this data history from publicly available records. To have your information removed, we recommend requesting removal directly through your county’s website.
| Date | Status | Borrower | Loan Amount |
|---|---|---|---|
| Open | Iola B Johnston Ft | $119,003 | |
| Closed | Iola B Johnston Ft | $15,000 | |
| Closed | Iola B Johnston Ft | $126,875 |
Source: Public Records
Tax History
| Year | Tax Paid | Tax Assessment Tax Assessment Total Assessment is a certain percentage of the fair market value that is determined by local assessors to be the total taxable value of land and additions on the property. | Land | Improvement |
|---|---|---|---|---|
| 2025 | $8,762 | $212,560 | $93,800 | $118,760 |
| 2024 | $5,502 | $127,310 | $65,100 | $62,210 |
| 2023 | $5,319 | $127,310 | $65,100 | $62,210 |
| 2022 | $5,230 | $127,310 | $65,100 | $62,210 |
| 2021 | $5,178 | $127,310 | $65,100 | $62,210 |
| 2020 | $5,180 | $127,310 | $65,100 | $62,210 |
| 2019 | $5,187 | $127,310 | $65,100 | $62,210 |
| 2018 | $5,444 | $133,500 | $63,800 | $69,700 |
| 2017 | $5,309 | $133,500 | $63,800 | $69,700 |
| 2016 | $5,145 | $133,500 | $63,800 | $69,700 |
| 2015 | $5,098 | $133,500 | $63,800 | $69,700 |
| 2014 | $4,905 | $133,500 | $63,800 | $69,700 |
Source: Public Records
Map
Nearby Homes
- 86 Dudley Rd
- 44 Beverly Rd
- 146 Dudley Rd
- 597 Wolcott Hill Rd
- 107 Coleman Rd
- 43 Edward St
- 127 Stillwold Dr
- 105 Midwell Rd
- 273 Dix Rd
- 32 Meadowgate St
- 35 Stillwold Dr
- 149 Mill St
- 185 Spring St Unit 185
- 7 Sharon Ln Unit 7
- 147 Spring St
- 492 Maple St
- 80 Grist Mill Rd
- 718 Silas Deane Hwy
- 81 Belcher Rd
- 31 Somerset St
Your Personal Tour Guide
Ask me questions while you tour the home.