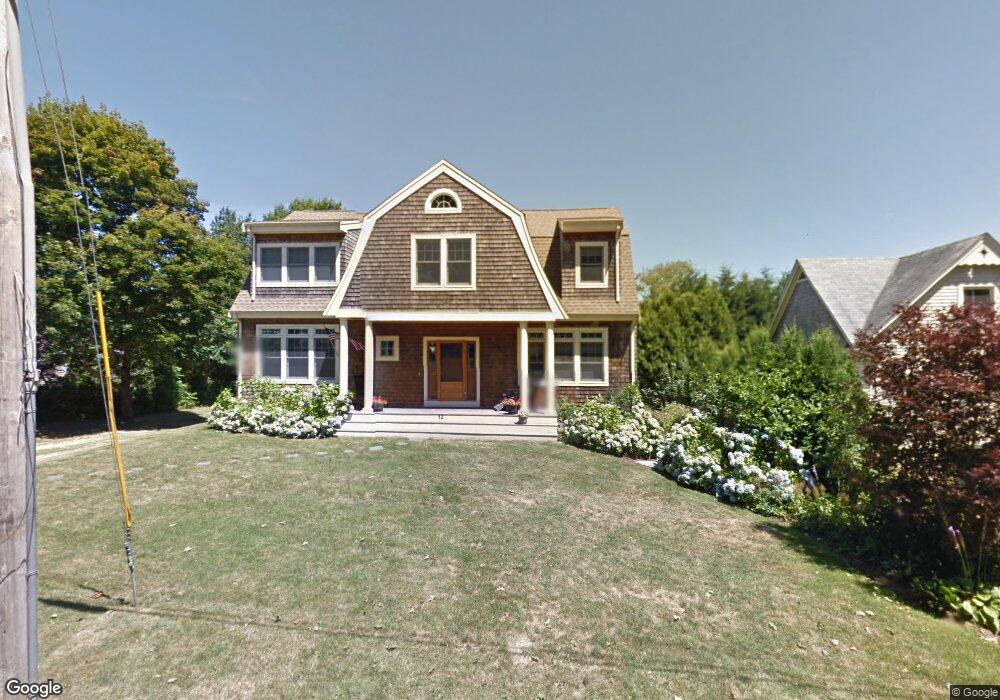
32 Calvert Place Jamestown, RI 02835
Jamestown Village NeighborhoodEstimated Value: $1,389,203 - $1,982,000
3
Beds
3
Baths
2,354
Sq Ft
$702/Sq Ft
Est. Value
About This Home
This home is located at 32 Calvert Place, Jamestown, RI 02835 and is currently estimated at $1,651,551, approximately $701 per square foot. 32 Calvert Place is a home located in Newport County with nearby schools including Melrose Avenue School and Lawn Avenue School.
Ownership History
Date
Name
Owned For
Owner Type
Purchase Details
Closed on
Apr 11, 2024
Sold by
Stoutenburgh Ret and Stotenburgh
Bought by
Cerilli Bradford D and Cerilli Susan M
Current Estimated Value
Home Financials for this Owner
Home Financials are based on the most recent Mortgage that was taken out on this home.
Original Mortgage
$550,000
Outstanding Balance
$537,908
Interest Rate
6%
Mortgage Type
Adjustable Rate Mortgage/ARM
Estimated Equity
$1,113,643
Purchase Details
Closed on
Feb 5, 2020
Sold by
Stoutenburgh Richard B
Bought by
Stoutenburgh Ret
Purchase Details
Closed on
May 31, 2018
Sold by
Gilroy Matthew J and Gilroy Ronda A
Bought by
Stoutenberg Richard B
Purchase Details
Closed on
Mar 19, 2004
Sold by
Phillips Kevin and Phillips Joanne
Bought by
Clark Ronda
Home Financials for this Owner
Home Financials are based on the most recent Mortgage that was taken out on this home.
Original Mortgage
$225,000
Interest Rate
5.71%
Mortgage Type
Purchase Money Mortgage
Purchase Details
Closed on
Mar 30, 2001
Sold by
Deterra David A
Bought by
Phillips Kevin E and Phillips Joanne
Create a Home Valuation Report for This Property
The Home Valuation Report is an in-depth analysis detailing your home's value as well as a comparison with similar homes in the area
Home Values in the Area
Average Home Value in this Area
Purchase History
| Date | Buyer | Sale Price | Title Company |
|---|---|---|---|
| Cerilli Bradford D | $1,350,000 | None Available | |
| Cerilli Bradford D | $1,350,000 | None Available | |
| Stoutenburgh Ret | -- | None Available | |
| Stoutenberg Richard B | $825,000 | -- | |
| Clark Ronda | $425,000 | -- | |
| Phillips Kevin E | $205,000 | -- | |
| Stoutenberg Richard B | $825,000 | -- | |
| Clark Ronda | $425,000 | -- | |
| Phillips Kevin E | $205,000 | -- |
Source: Public Records
Mortgage History
| Date | Status | Borrower | Loan Amount |
|---|---|---|---|
| Open | Cerilli Bradford D | $550,000 | |
| Closed | Cerilli Bradford D | $550,000 | |
| Previous Owner | Phillips Kevin E | $417,000 | |
| Previous Owner | Phillips Kevin E | $417,000 | |
| Previous Owner | Phillips Kevin E | $225,000 |
Source: Public Records
Tax History
| Year | Tax Paid | Tax Assessment Tax Assessment Total Assessment is a certain percentage of the fair market value that is determined by local assessors to be the total taxable value of land and additions on the property. | Land | Improvement |
|---|---|---|---|---|
| 2025 | $6,831 | $1,211,100 | $559,700 | $651,400 |
| 2024 | $6,175 | $861,200 | $424,300 | $436,900 |
| 2023 | $6,011 | $861,200 | $424,300 | $436,900 |
| 2022 | $5,848 | $861,200 | $424,300 | $436,900 |
| 2021 | $5,948 | $718,400 | $342,800 | $375,600 |
| 2020 | $5,797 | $718,400 | $342,800 | $375,600 |
| 2019 | $5,783 | $718,400 | $342,800 | $375,600 |
| 2018 | $4,929 | $557,000 | $242,800 | $314,200 |
| 2017 | $4,800 | $554,300 | $242,800 | $311,500 |
| 2016 | $4,756 | $554,300 | $242,800 | $311,500 |
| 2015 | $4,914 | $559,700 | $269,600 | $290,100 |
| 2014 | $4,897 | $559,700 | $269,600 | $290,100 |
Source: Public Records
Map
Nearby Homes
- 63 Longfellow Rd
- 31 Buloid Ave
- 127 Longfellow Rd
- 73 Conanicus Ave Unit 4
- 46 North Rd
- 63 Pemberton Ave
- 78 Narragansett Ave
- 14 Clinton Ave
- 22 Cole St
- 24 Southwest Ave
- 22 Southwest Ave
- 30 Walcott Ave
- 48 Ocean Ave
- 30 W Bay View Dr
- 104 Howland Ave
- 10 Coulter St
- 121 Seaside Dr
- 174 Seaside Dr
- 74 Third St
- 30 Bonnet View Dr
- 27 Pennsylvania Ave
- 28 Calvert Place
- 41 Calvert Place
- 39 Pennsylvania Ave
- 5 Center St
- 26 Pennsylvania Ave
- 29 Calvert Place
- 21 Calvert Place
- 40 Pennsylvania Ave
- 45 Pennsylvania Ave
- 35 Calvert Place
- 18 Calvert Place
- 3 Center St
- 45 Calvert Place
- 20 Florida Ave
- 17 Pennsylvania Ave
- 15 Calvert Place
- 46 Pennsylvania Ave
- 0 Florida Ave
- 31 Calvert Place
Your Personal Tour Guide
Ask me questions while you tour the home.