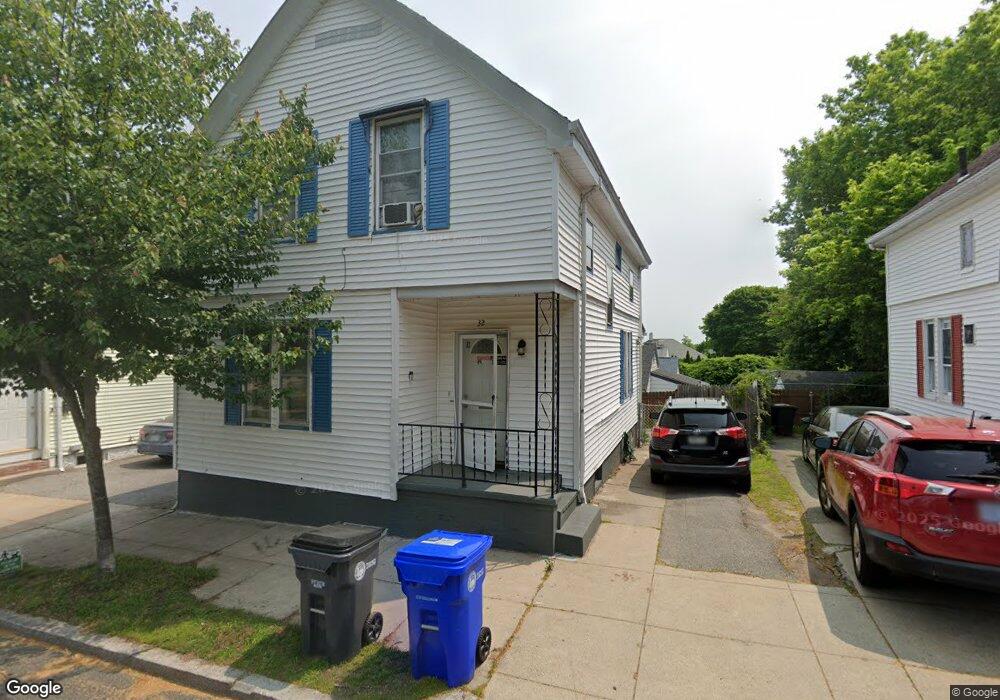
32 Carleton St Providence, RI 02908
Mount Pleasant NeighborhoodEstimated Value: $281,000 - $350,970
4
Beds
1
Bath
1,450
Sq Ft
$224/Sq Ft
Est. Value
About This Home
This home is located at 32 Carleton St, Providence, RI 02908 and is currently estimated at $324,243, approximately $223 per square foot. 32 Carleton St is a home located in Providence County with nearby schools including Blessed Sacrament School and Mount Pleasant Academy.
Ownership History
Date
Name
Owned For
Owner Type
Purchase Details
Closed on
Dec 4, 2000
Sold by
Lyons Raymond T
Bought by
Maurice Luckner
Current Estimated Value
Home Financials for this Owner
Home Financials are based on the most recent Mortgage that was taken out on this home.
Original Mortgage
$75,281
Interest Rate
7.76%
Purchase Details
Closed on
Jan 19, 1995
Sold by
Grabbert Stephen J and Grabbert Beth
Bought by
Lyons Raymond T
Create a Home Valuation Report for This Property
The Home Valuation Report is an in-depth analysis detailing your home's value as well as a comparison with similar homes in the area
Home Values in the Area
Average Home Value in this Area
Purchase History
| Date | Buyer | Sale Price | Title Company |
|---|---|---|---|
| Maurice Luckner | $77,500 | -- | |
| Lyons Raymond T | $62,000 | -- |
Source: Public Records
Mortgage History
| Date | Status | Borrower | Loan Amount |
|---|---|---|---|
| Open | Lyons Raymond T | $110,026 | |
| Closed | Lyons Raymond T | $75,281 | |
| Previous Owner | Lyons Raymond T | $74,250 | |
| Previous Owner | Lyons Raymond T | $13,500 |
Source: Public Records
Tax History
| Year | Tax Paid | Tax Assessment Tax Assessment Total Assessment is a certain percentage of the fair market value that is determined by local assessors to be the total taxable value of land and additions on the property. | Land | Improvement |
|---|---|---|---|---|
| 2025 | $2,286 | $272,100 | $108,800 | $163,300 |
| 2024 | $3,558 | $193,900 | $66,100 | $127,800 |
| 2023 | $3,558 | $193,900 | $66,100 | $127,800 |
| 2022 | $3,451 | $193,900 | $66,100 | $127,800 |
| 2021 | $3,099 | $126,200 | $44,400 | $81,800 |
| 2020 | $3,099 | $126,200 | $44,400 | $81,800 |
| 2019 | $3,099 | $126,200 | $44,400 | $81,800 |
| 2018 | $2,803 | $87,700 | $35,000 | $52,700 |
| 2017 | $2,803 | $87,700 | $35,000 | $52,700 |
| 2016 | $2,803 | $87,700 | $35,000 | $52,700 |
| 2015 | $2,651 | $80,100 | $29,600 | $50,500 |
| 2014 | $2,703 | $80,100 | $29,600 | $50,500 |
| 2013 | $2,703 | $80,100 | $29,600 | $50,500 |
Source: Public Records
Map
Nearby Homes
Your Personal Tour Guide
Ask me questions while you tour the home.