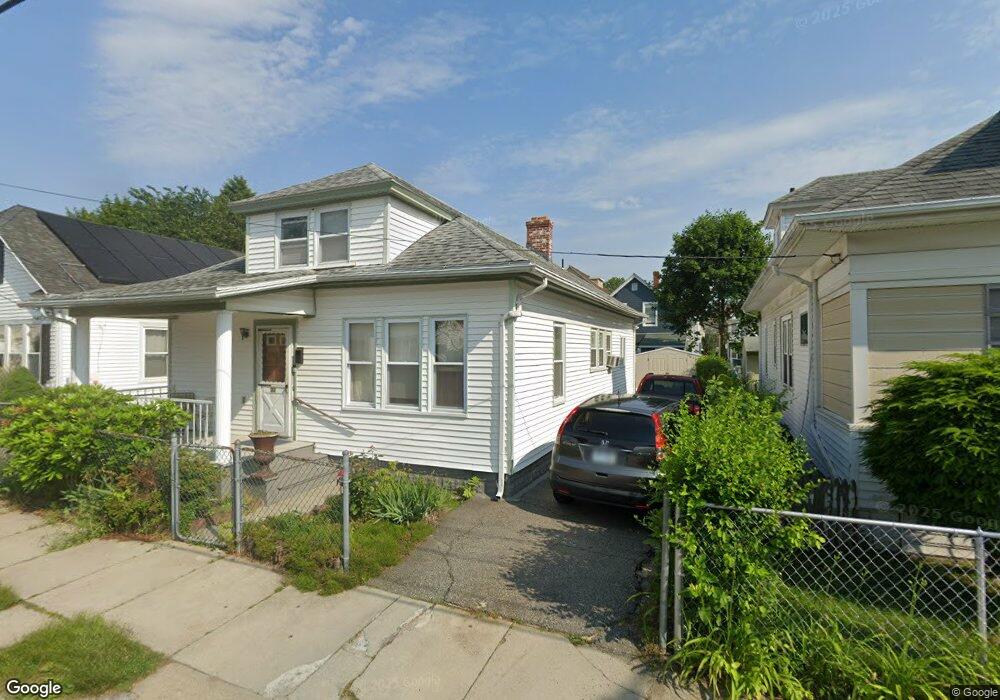
32 Carr St Providence, RI 02905
Washington Park NeighborhoodEstimated Value: $367,000 - $406,322
3
Beds
2
Baths
1,560
Sq Ft
$252/Sq Ft
Est. Value
About This Home
This home is located at 32 Carr St, Providence, RI 02905 and is currently estimated at $392,581, approximately $251 per square foot. 32 Carr St is a home located in Providence County with nearby schools including Highlander Charter School and Saint Paul School.
Ownership History
Date
Name
Owned For
Owner Type
Purchase Details
Closed on
Jul 2, 2024
Sold by
Providence City Of
Bought by
Casey Realty Rigop
Current Estimated Value
Purchase Details
Closed on
Jun 30, 2023
Sold by
Providence City Of and Costa
Bought by
Jev Financial Corp
Purchase Details
Closed on
Aug 13, 2020
Sold by
Costa Alda R
Bought by
Costa Ret and Costa
Create a Home Valuation Report for This Property
The Home Valuation Report is an in-depth analysis detailing your home's value as well as a comparison with similar homes in the area
Home Values in the Area
Average Home Value in this Area
Purchase History
| Date | Buyer | Sale Price | Title Company |
|---|---|---|---|
| Casey Realty Rigop | $5,354 | None Available | |
| Casey Realty Rigop | $5,354 | None Available | |
| Casey Realty Rigop | $5,354 | None Available | |
| Casey Realty Rigop | $5,354 | None Available | |
| Jev Financial Corp | $5,203 | None Available | |
| Jev Financial Corp | $5,203 | None Available | |
| Jev Financial Corp | $5,203 | None Available | |
| Jev Financial Corp | $5,203 | None Available | |
| Costa Ret | -- | None Available | |
| Costa Ret | -- | None Available | |
| Costa Ret | -- | None Available | |
| Costa Ret | -- | None Available |
Source: Public Records
Tax History
| Year | Tax Paid | Tax Assessment Tax Assessment Total Assessment is a certain percentage of the fair market value that is determined by local assessors to be the total taxable value of land and additions on the property. | Land | Improvement |
|---|---|---|---|---|
| 2025 | $2,649 | $315,300 | $118,800 | $196,500 |
| 2024 | $4,523 | $246,500 | $75,300 | $171,200 |
| 2023 | $4,523 | $246,500 | $75,300 | $171,200 |
| 2022 | $4,388 | $246,500 | $75,300 | $171,200 |
| 2021 | $3,628 | $147,700 | $33,200 | $114,500 |
| 2020 | $3,628 | $147,700 | $33,200 | $114,500 |
| 2019 | $3,628 | $147,700 | $33,200 | $114,500 |
| 2018 | $3,803 | $119,000 | $30,200 | $88,800 |
| 2017 | $3,803 | $119,000 | $30,200 | $88,800 |
| 2016 | $3,803 | $119,000 | $30,200 | $88,800 |
| 2015 | $3,532 | $106,700 | $30,200 | $76,500 |
| 2014 | $3,601 | $106,700 | $30,200 | $76,500 |
| 2013 | $3,601 | $106,700 | $30,200 | $76,500 |
Source: Public Records
Map
Nearby Homes
- 55 Homer St
- 77 Payton St
- 52 Cactus St
- 61 Cyr St
- 390 Montgomery Ave
- 286 California Ave
- 255 Ohio Ave
- 139 Babcock St
- 183 Baker St
- 162 Verndale Ave
- 233 California Ave
- 273 Montgomery Ave
- 274 Montgomery Ave
- 358 Northup St
- 208 California Ave
- 325 Northup St
- 180 Ohio Ave
- 160 Ohio Ave
- 175 Montgomery Ave
- 133 Byfield St
Your Personal Tour Guide
Ask me questions while you tour the home.