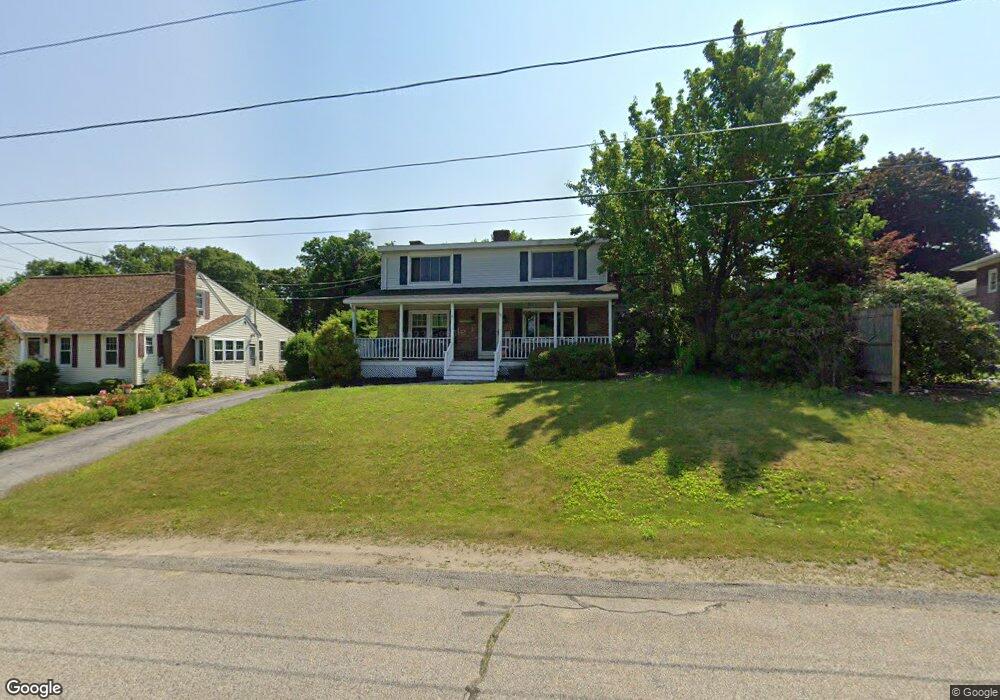
32 Carroll St Auburn, MA 01501
Stoneville NeighborhoodEstimated Value: $511,873 - $577,000
4
Beds
2
Baths
1,904
Sq Ft
$279/Sq Ft
Est. Value
About This Home
This home is located at 32 Carroll St, Auburn, MA 01501 and is currently estimated at $530,718, approximately $278 per square foot. 32 Carroll St is a home located in Worcester County with nearby schools including Auburn Senior High School and Shrewsbury Montessori School - Auburn Campus.
Ownership History
Date
Name
Owned For
Owner Type
Purchase Details
Closed on
Jul 22, 2004
Sold by
Mercando Anthony J and Mercando Sharon W
Bought by
Stannard Christopher J and Stannard Maryann E
Current Estimated Value
Home Financials for this Owner
Home Financials are based on the most recent Mortgage that was taken out on this home.
Original Mortgage
$297,395
Outstanding Balance
$149,157
Interest Rate
6.28%
Mortgage Type
Purchase Money Mortgage
Estimated Equity
$381,561
Purchase Details
Closed on
Jul 22, 1997
Sold by
Mercando Anthony J and Mercando Jane M
Bought by
Mercando Anthony J
Create a Home Valuation Report for This Property
The Home Valuation Report is an in-depth analysis detailing your home's value as well as a comparison with similar homes in the area
Home Values in the Area
Average Home Value in this Area
Purchase History
| Date | Buyer | Sale Price | Title Company |
|---|---|---|---|
| Stannard Christopher J | $293,000 | -- | |
| Mercando Anthony J | $26,500 | -- |
Source: Public Records
Mortgage History
| Date | Status | Borrower | Loan Amount |
|---|---|---|---|
| Open | Stannard Christopher J | $297,395 | |
| Previous Owner | Mercando Anthony J | $94,000 | |
| Previous Owner | Mercando Anthony J | $93,000 | |
| Previous Owner | Mercando Anthony J | $93,500 |
Source: Public Records
Tax History
| Year | Tax Paid | Tax Assessment Tax Assessment Total Assessment is a certain percentage of the fair market value that is determined by local assessors to be the total taxable value of land and additions on the property. | Land | Improvement |
|---|---|---|---|---|
| 2025 | $67 | $470,000 | $126,000 | $344,000 |
| 2024 | $6,851 | $458,900 | $119,900 | $339,000 |
| 2023 | $6,549 | $412,400 | $109,000 | $303,400 |
| 2022 | $6,075 | $361,200 | $109,000 | $252,200 |
| 2021 | $4,128 | $326,400 | $96,200 | $230,200 |
| 2020 | $5,865 | $326,200 | $96,200 | $230,000 |
| 2019 | $3,756 | $309,900 | $95,200 | $214,700 |
| 2018 | $3,528 | $302,100 | $89,000 | $213,100 |
| 2017 | $5,388 | $293,800 | $80,700 | $213,100 |
| 2016 | $5,125 | $283,300 | $84,700 | $198,600 |
| 2015 | $4,674 | $270,800 | $84,700 | $186,100 |
| 2014 | $4,575 | $264,600 | $80,700 | $183,900 |
Source: Public Records
Map
Nearby Homes
- 99 Clover St
- 177 Boyce St
- 5 Commonwealth Ave
- 27 Havana Rd
- 25 Vinal St Unit 28
- 25 Vinal St Unit 26
- 25 Vinal St Unit 29
- 25 Vinal St Unit 30
- 11 Hulbert Rd Unit 13
- 1 Rockland Road Ct
- 177 Oxford St N
- 103 Henshaw St
- 84 Eureka St
- 55 Grandview Ave
- 19-20 Williams St
- 40 Bryn Mawr Ave
- 32 Goddard Memorial Dr
- 13 Merchant St
- 1-9 Helens Way
- 1511 Main St Unit C405
Your Personal Tour Guide
Ask me questions while you tour the home.