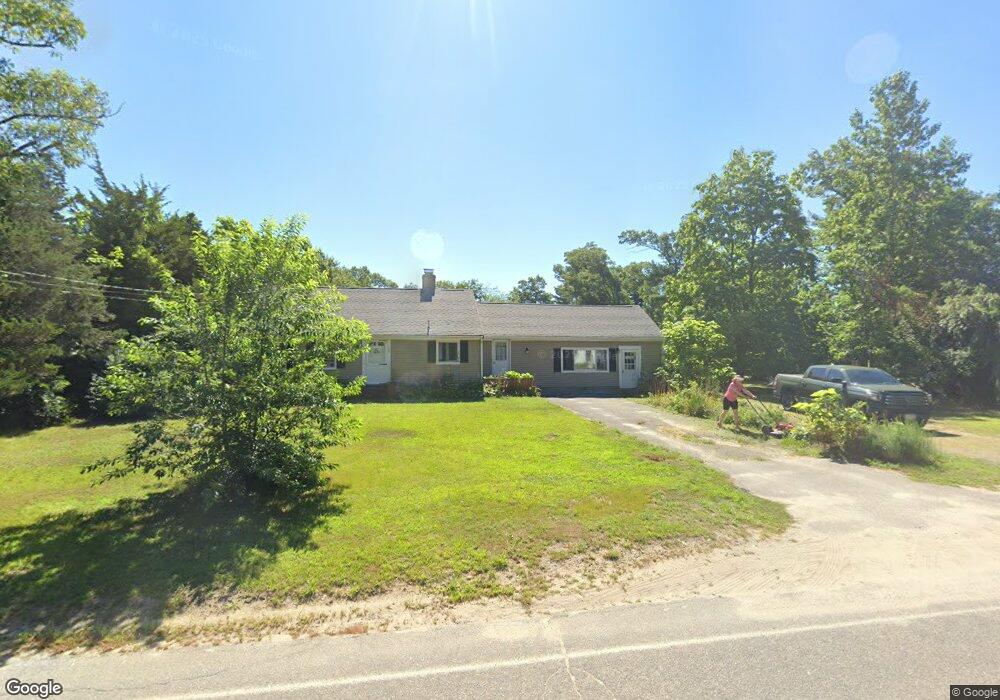
32 Carver Rd West Wareham, MA 02576
Estimated Value: $527,885 - $568,000
3
Beds
2
Baths
1,200
Sq Ft
$459/Sq Ft
Est. Value
About This Home
This home is located at 32 Carver Rd, West Wareham, MA 02576 and is currently estimated at $551,221, approximately $459 per square foot. 32 Carver Rd is a home located in Plymouth County.
Ownership History
Date
Name
Owned For
Owner Type
Purchase Details
Closed on
Jul 12, 2013
Sold by
Ivester David
Bought by
Voner Taylor T
Current Estimated Value
Home Financials for this Owner
Home Financials are based on the most recent Mortgage that was taken out on this home.
Original Mortgage
$272,448
Outstanding Balance
$196,063
Interest Rate
3.83%
Mortgage Type
New Conventional
Estimated Equity
$355,158
Purchase Details
Closed on
Dec 21, 2012
Sold by
Fhlmc
Bought by
Ivester David A
Purchase Details
Closed on
Jun 6, 2012
Sold by
Morrow Eric and Us Bank Na
Bought by
Fhlmc
Purchase Details
Closed on
Apr 22, 2004
Sold by
Eaton Lois A
Bought by
Morrow Eric
Purchase Details
Closed on
Nov 22, 1996
Sold by
Clark Kathleen E and Silva Marianne
Bought by
Card Lois A and Eaton Shawn P
Purchase Details
Closed on
Jun 1, 1994
Sold by
Brundage Edwin G and Brundage Joan C
Bought by
Clark Kathleen E and Silva Marianne
Create a Home Valuation Report for This Property
The Home Valuation Report is an in-depth analysis detailing your home's value as well as a comparison with similar homes in the area
Home Values in the Area
Average Home Value in this Area
Purchase History
| Date | Buyer | Sale Price | Title Company |
|---|---|---|---|
| Voner Taylor T | $267,000 | -- | |
| Voner Taylor T | $267,000 | -- | |
| Voner Taylor T | $267,000 | -- | |
| Ivester David A | $110,000 | -- | |
| Ivester David A | $110,000 | -- | |
| Fhlmc | $159,451 | -- | |
| Fhlmc | $159,451 | -- | |
| Morrow Eric | $252,000 | -- | |
| Morrow Eric | $252,000 | -- | |
| Card Lois A | $117,000 | -- | |
| Card Lois A | $117,000 | -- | |
| Clark Kathleen E | $106,000 | -- | |
| Clark Kathleen E | $106,000 | -- |
Source: Public Records
Mortgage History
| Date | Status | Borrower | Loan Amount |
|---|---|---|---|
| Open | Voner Taylor T | $272,448 | |
| Closed | Voner Taylor T | $272,448 | |
| Previous Owner | Clark Kathleen E | $250,200 |
Source: Public Records
Tax History Compared to Growth
Tax History
| Year | Tax Paid | Tax Assessment Tax Assessment Total Assessment is a certain percentage of the fair market value that is determined by local assessors to be the total taxable value of land and additions on the property. | Land | Improvement |
|---|---|---|---|---|
| 2025 | $4,667 | $447,900 | $130,400 | $317,500 |
| 2024 | $4,788 | $426,400 | $104,400 | $322,000 |
| 2023 | $4,306 | $382,300 | $95,100 | $287,200 |
| 2022 | $4,306 | $326,700 | $95,100 | $231,600 |
| 2021 | $4,253 | $316,200 | $95,100 | $221,100 |
| 2020 | $3,962 | $298,800 | $95,100 | $203,700 |
| 2019 | $3,790 | $285,200 | $97,700 | $187,500 |
| 2018 | $3,566 | $261,600 | $97,700 | $163,900 |
| 2017 | $3,290 | $244,600 | $97,700 | $146,900 |
| 2016 | $3,036 | $224,400 | $97,700 | $126,700 |
| 2015 | $2,933 | $224,400 | $97,700 | $126,700 |
| 2014 | $2,797 | $217,700 | $97,700 | $120,000 |
Source: Public Records
Map
Nearby Homes
- 47 Weaver St
- 2230 Cranberry Hwy Unit 1
- 563 County Rd
- 20 Gault Rd
- 51 Crest Dr
- 103 Castle Dr
- 72 Papermill Rd Unit 72
- 27 Siesta Dr
- 4 Siesta Dr
- 11 Acoaxet Ln
- 41 Longboat Rd
- 11 Fonseca Way
- 59 Timber Ln
- 87 Great Hill Dr
- 527 High St
- 490 High St
- 189 Pine View Terrace
- 7 Forbes Rd
- 199 Windswept Rd
- 46 Helen St
- 32 Carver
- 30 Carver Rd
- 56 Carver Rd
- 8 Pond View Terrace
- 3 Pond View Terrace
- 47 Carver Rd
- 34 Carver Rd
- 6 Pond View Terrace
- 53 Carver Rd
- 43 Carver Rd
- 51 Carver Rd
- 37 Carver Rd
- 5 Pond View Terrace
- 5 Pond View Terrace
- 39 Carver Rd
- 55 Carver Rd
- 55 Carver Rd
- 57 Carver Rd
- 4 Pond View Terrace
- 9 Pond View Terrace