
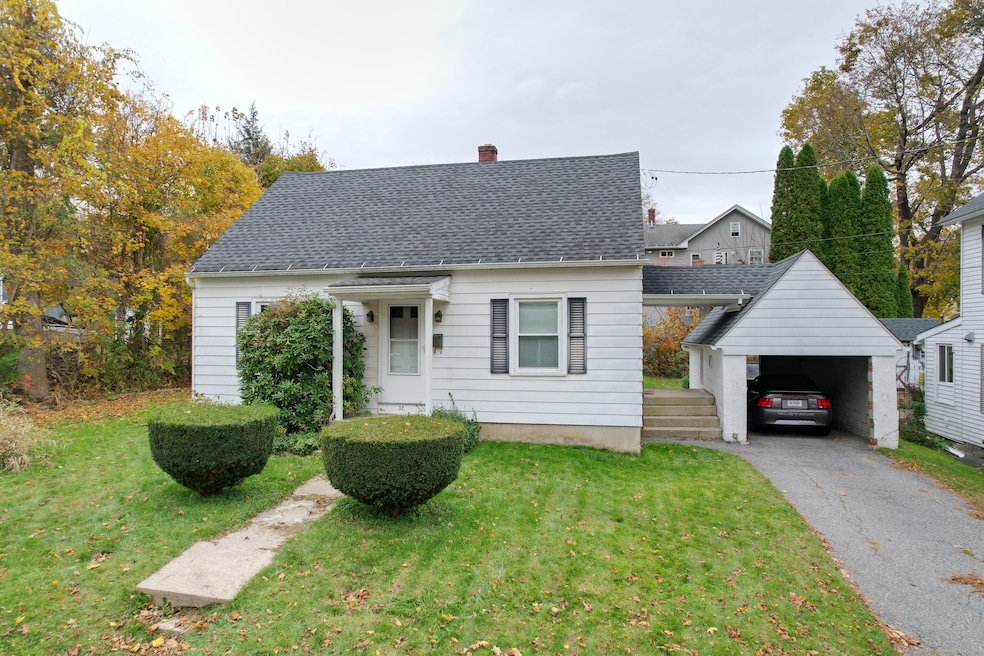
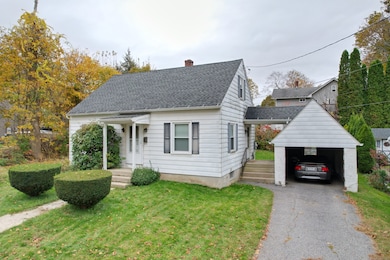
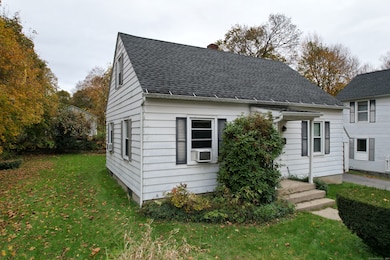
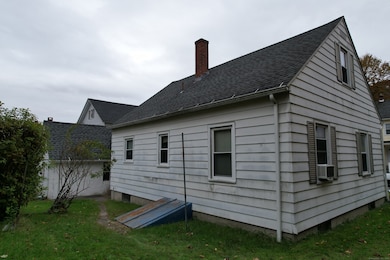
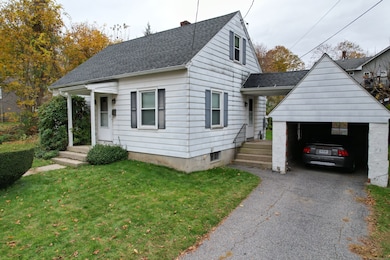
32 Charles St Winsted, CT 06098
Estimated payment $1,504/month
Total Views
5,977
3
Beds
1
Bath
1,044
Sq Ft
$220
Price per Sq Ft
Highlights
- Cape Cod Architecture
- Hot Water Circulator
- Hot Water Heating System
About This Home
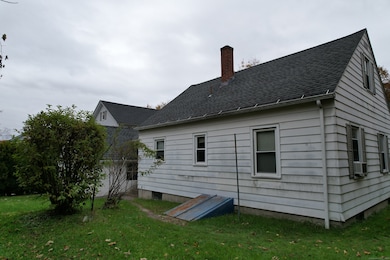
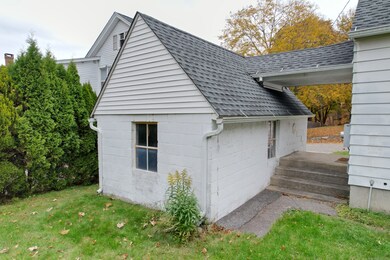
Charming Cape on a Quiet Dead-End Street Welcome to 32 Charles Street - a cute and cozy 1,044 sq. ft. Cape-style home located just moments from the downtown area. The first floor offers an inviting eat-in kitchen, a comfortable living room, two bedrooms, and a full bath. Upstairs, you'll find one additional bedroom and 1 room providing flexibility for guests, a home office, or hobby space. The home also features a one-car garage and recent mechanical updates, including a newer heating system and oil tank (both just two years old). Whether you're a first-time owner or looking to downsize, this well-maintained home offers comfort, convenience, and a great location!
Listing Agent
Northwest CT Realty Brokerage Phone: (860) 806-0225 License #REB.0756887 Listed on: 10/29/2025
Home Details
Home Type
- Single Family
Est. Annual Taxes
- $3,592
Year Built
- Built in 1953
Lot Details
- 6,534 Sq Ft Lot
- Property is zoned R-4
Parking
- 1 Car Garage
Home Design
- Cape Cod Architecture
- Concrete Foundation
- Frame Construction
- Asphalt Shingled Roof
- Aluminum Siding
Interior Spaces
- 1,044 Sq Ft Home
- Basement Fills Entire Space Under The House
- Oven or Range
Bedrooms and Bathrooms
- 3 Bedrooms
- 1 Full Bathroom
Schools
- Gilbert High School
Utilities
- Hot Water Heating System
- Heating System Uses Oil
- Hot Water Circulator
- Fuel Tank Located in Basement
Listing and Financial Details
- Assessor Parcel Number 928816
Map
Create a Home Valuation Report for This Property
The Home Valuation Report is an in-depth analysis detailing your home's value as well as a comparison with similar homes in the area
Home Values in the Area
Average Home Value in this Area
Tax History
| Year | Tax Paid | Tax Assessment Tax Assessment Total Assessment is a certain percentage of the fair market value that is determined by local assessors to be the total taxable value of land and additions on the property. | Land | Improvement |
|---|---|---|---|---|
| 2025 | $3,592 | $123,130 | $24,780 | $98,350 |
| 2024 | $3,354 | $123,130 | $24,780 | $98,350 |
| 2023 | $3,249 | $123,130 | $24,780 | $98,350 |
| 2022 | $2,719 | $81,060 | $17,920 | $63,140 |
| 2021 | $2,719 | $81,060 | $17,920 | $63,140 |
| 2020 | $2,719 | $81,060 | $17,920 | $63,140 |
| 2019 | $2,719 | $81,060 | $17,920 | $63,140 |
| 2018 | $2,719 | $81,060 | $17,920 | $63,140 |
| 2017 | $2,637 | $78,610 | $17,920 | $60,690 |
| 2016 | $2,637 | $78,610 | $17,920 | $60,690 |
| 2015 | $2,571 | $78,610 | $17,920 | $60,690 |
| 2014 | -- | $78,610 | $17,920 | $60,690 |
Source: Public Records
Property History
| Date | Event | Price | List to Sale | Price per Sq Ft |
|---|---|---|---|---|
| 10/29/2025 10/29/25 | For Sale | $229,900 | -- | $220 / Sq Ft |
Source: SmartMLS
Purchase History
| Date | Type | Sale Price | Title Company |
|---|---|---|---|
| Quit Claim Deed | -- | None Available | |
| Quit Claim Deed | -- | None Available | |
| Quit Claim Deed | -- | None Available | |
| Quit Claim Deed | -- | -- | |
| Quit Claim Deed | -- | -- | |
| Quit Claim Deed | -- | -- | |
| Deed | -- | -- | |
| Quit Claim Deed | -- | -- | |
| Quit Claim Deed | -- | -- |
Source: Public Records
About the Listing Agent
With over two decades of experience in the real estate industry, David Sartirana has earned a reputation as a highly respected professional known for his commitment to excellence, deep industry knowledge, and passion for contributing to the real estate community. David's extensive background in real estate is complemented by his active participation in various real estate associations, which allows him to provide exceptional value to his clients.
Real Estate Leadership Roles
As a Director
David's Other Listings
Source: SmartMLS
MLS Number: 24136816
APN: WINC-000115-000061-000004A
Disclaimer: Certain information contained herein is derived from information provided by parties other than Homes.com. All information provided is deemed reliable, but is not guaranteed to be accurate and should be independently verified.
![]() IDX information is provided exclusively for personal, non-commercial use, and may not be used for any purpose other than to identify prospective properties consumers may be interested in purchasing. Information is deemed reliable but not guaranteed.
IDX information is provided exclusively for personal, non-commercial use, and may not be used for any purpose other than to identify prospective properties consumers may be interested in purchasing. Information is deemed reliable but not guaranteed.
Nearby Homes
- 22 Upson Ave
- 135 Elm St Unit 1
- 188 E Lake St
- 144 Wetmore Ave Unit 1
- 101 Whiting St
- 217 N Main St Unit 2
- 220 Walnut St
- 31 Benton St
- 12 Beach St Unit 7
- 121 W Wakefield Blvd
- 13 Wallens St
- 15 Mountain View Terrace
- 880 W Wakefield Blvd
- 213 Ledge Dr Unit 213
- 51 Devaux Rd
- 537 Main St Unit 537B
- 35 Prospect St
- 35 Prospect St
- 17 Vickers Rd
- 45 Hoppen Rd