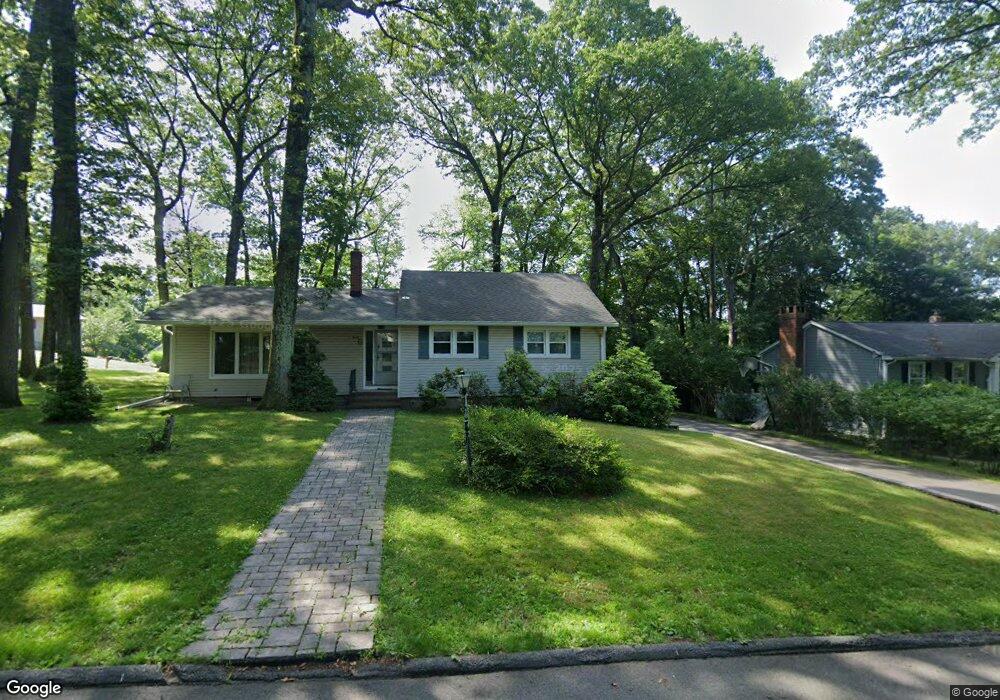
32 Clover Ln Randolph, NJ 07869
Estimated Value: $559,573 - $761,000
Studio
--
Bath
1,348
Sq Ft
$512/Sq Ft
Est. Value
About This Home
This home is located at 32 Clover Ln, Randolph, NJ 07869 and is currently estimated at $689,893, approximately $511 per square foot. 32 Clover Ln is a home located in Morris County with nearby schools including Randolph High School, Randolph Middle School, and Cheder Lubavitch.
Ownership History
Date
Name
Owned For
Owner Type
Purchase Details
Closed on
Nov 22, 2006
Sold by
Kirshenbaum Caroline
Bought by
Kirshenbaum Kenneth and Kirshenbaum Jane
Current Estimated Value
Home Financials for this Owner
Home Financials are based on the most recent Mortgage that was taken out on this home.
Original Mortgage
$300,000
Outstanding Balance
$179,342
Interest Rate
6.4%
Mortgage Type
New Conventional
Estimated Equity
$510,551
Create a Home Valuation Report for This Property
The Home Valuation Report is an in-depth analysis detailing your home's value as well as a comparison with similar homes in the area
Home Values in the Area
Average Home Value in this Area
Purchase History
| Date | Buyer | Sale Price | Title Company |
|---|---|---|---|
| Kirshenbaum Kenneth | $380,000 | -- |
Source: Public Records
Mortgage History
| Date | Status | Borrower | Loan Amount |
|---|---|---|---|
| Open | Kirshenbaum Kenneth | $300,000 |
Source: Public Records
Tax History
| Year | Tax Paid | Tax Assessment Tax Assessment Total Assessment is a certain percentage of the fair market value that is determined by local assessors to be the total taxable value of land and additions on the property. | Land | Improvement |
|---|---|---|---|---|
| 2025 | $9,988 | $352,800 | $186,900 | $165,900 |
| 2024 | $9,737 | $352,800 | $186,900 | $165,900 |
Source: Public Records
Map
Nearby Homes
- 14 Fieldstone Ct
- 3 Springhill Rd
- 10 Forrest Rd
- 10 Bayberry Ln
- 5 Elaine Ct
- 4A Southview Rd
- 24 Raynor Rd
- 8 Cherry Ln
- 138 Shady Ln
- 15 Southview Rd
- 34 Starlight Dr
- 267 Washington Valley Rd
- 46 W Hanover Ave
- 33 Shongum Rd
- 44 Shongum Rd
- 188 Casterline Rd
- 41 Beverly St
- 20 Mount Pleasant Rd
- 20 Mount Pleasant Rd
- 384 Millbrook Ave
Your Personal Tour Guide
Ask me questions while you tour the home.