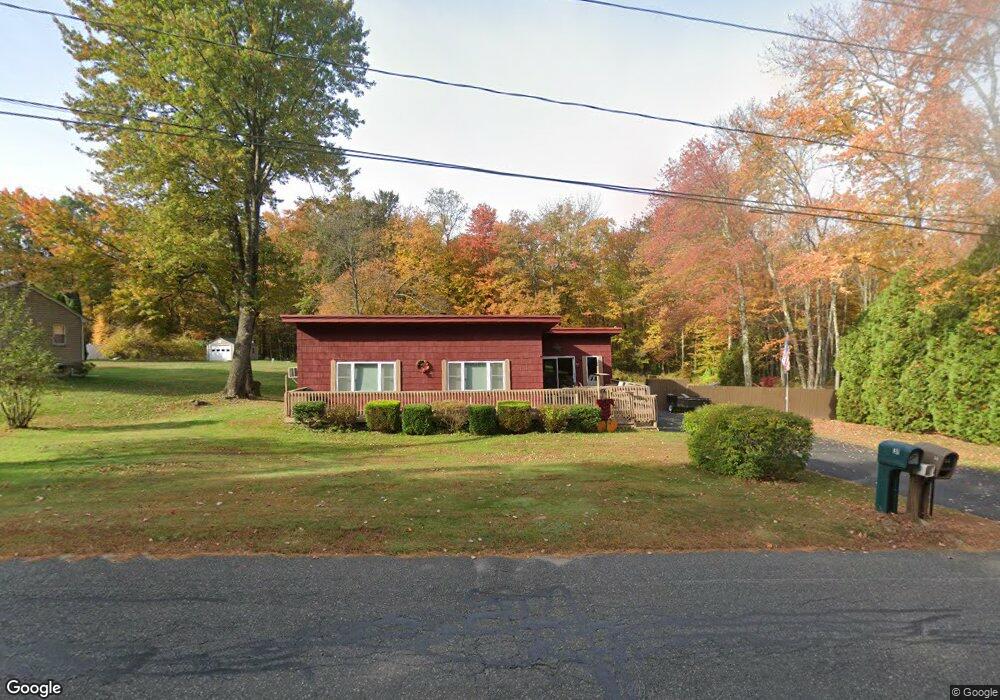
32 Coleman Rd Southampton, MA 01073
Estimated Value: $392,000 - $462,000
3
Beds
2
Baths
1,712
Sq Ft
$240/Sq Ft
Est. Value
About This Home
This home is located at 32 Coleman Rd, Southampton, MA 01073 and is currently estimated at $410,628, approximately $239 per square foot. 32 Coleman Rd is a home located in Hampshire County with nearby schools including William E Norris School, Hilltown Cooperative Charter Public School, and Calvary Baptist Christian School.
Ownership History
Date
Name
Owned For
Owner Type
Purchase Details
Closed on
Dec 8, 2004
Sold by
Moran Janet M
Bought by
Moran Janet M and Wells William Allen
Current Estimated Value
Purchase Details
Closed on
Jan 23, 1995
Sold by
Illingsworth Earl R and Illingsworth Janet M
Bought by
Moran Janet M
Home Financials for this Owner
Home Financials are based on the most recent Mortgage that was taken out on this home.
Original Mortgage
$40,000
Interest Rate
9.16%
Mortgage Type
Purchase Money Mortgage
Create a Home Valuation Report for This Property
The Home Valuation Report is an in-depth analysis detailing your home's value as well as a comparison with similar homes in the area
Home Values in the Area
Average Home Value in this Area
Purchase History
| Date | Buyer | Sale Price | Title Company |
|---|---|---|---|
| Moran Janet M | -- | -- | |
| Moran Janet M | $40,455 | -- |
Source: Public Records
Mortgage History
| Date | Status | Borrower | Loan Amount |
|---|---|---|---|
| Previous Owner | Moran Janet M | $40,000 |
Source: Public Records
Tax History Compared to Growth
Tax History
| Year | Tax Paid | Tax Assessment Tax Assessment Total Assessment is a certain percentage of the fair market value that is determined by local assessors to be the total taxable value of land and additions on the property. | Land | Improvement |
|---|---|---|---|---|
| 2025 | $4,189 | $295,600 | $89,800 | $205,800 |
| 2024 | $4,078 | $286,200 | $89,800 | $196,400 |
| 2023 | $3,683 | $257,000 | $89,800 | $167,200 |
| 2022 | $3,599 | $238,800 | $81,200 | $157,600 |
| 2021 | $3,485 | $218,200 | $75,200 | $143,000 |
| 2020 | $3,351 | $211,800 | $75,200 | $136,600 |
| 2019 | $3,270 | $200,500 | $75,200 | $125,300 |
| 2018 | $4,245 | $183,300 | $67,600 | $115,700 |
| 2017 | $4,098 | $183,300 | $67,600 | $115,700 |
| 2015 | $2,778 | $176,800 | $61,100 | $115,700 |
Source: Public Records
Map
Nearby Homes