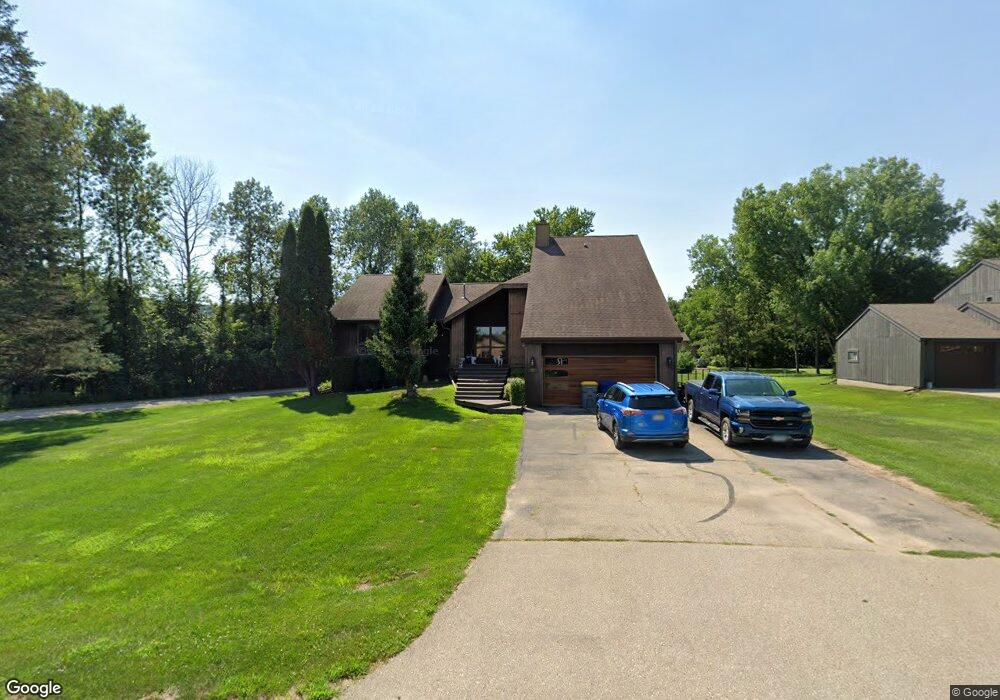
32 Crescent Ave La Crescent, MN 55947
Estimated Value: $378,000 - $455,000
5
Beds
5
Baths
2,180
Sq Ft
$193/Sq Ft
Est. Value
About This Home
This home is located at 32 Crescent Ave, La Crescent, MN 55947 and is currently estimated at $419,923, approximately $192 per square foot. 32 Crescent Ave is a home located in Houston County with nearby schools including La Crescent-Hokah Elementary School, La Crescent-Hokah Middle School, and La Crescent-Hokah High School.
Ownership History
Date
Name
Owned For
Owner Type
Purchase Details
Closed on
Jan 14, 2026
Sold by
Wayne Christopherson Llc
Bought by
Christopherson Wayne
Current Estimated Value
Purchase Details
Closed on
Mar 9, 2023
Sold by
Christopherson Wayne
Bought by
Wayne Christopherson Llc
Purchase Details
Closed on
Nov 15, 2017
Sold by
Brennan John T and Brennan Gwendoline M
Bought by
Christopherson Wayne
Purchase Details
Closed on
Jul 15, 2005
Sold by
Oldenburg Jacquelyn G
Bought by
Oldenburg Jacquelyn G
Create a Home Valuation Report for This Property
The Home Valuation Report is an in-depth analysis detailing your home's value as well as a comparison with similar homes in the area
Home Values in the Area
Average Home Value in this Area
Purchase History
| Date | Buyer | Sale Price | Title Company |
|---|---|---|---|
| Christopherson Wayne | $500 | None Listed On Document | |
| Wayne Christopherson Llc | $500 | -- | |
| Christopherson Wayne | $258,000 | -- | |
| Oldenburg Jacquelyn G | -- | None Available |
Source: Public Records
Tax History
| Year | Tax Paid | Tax Assessment Tax Assessment Total Assessment is a certain percentage of the fair market value that is determined by local assessors to be the total taxable value of land and additions on the property. | Land | Improvement |
|---|---|---|---|---|
| 2025 | $6,544 | $395,100 | $69,600 | $325,500 |
| 2024 | $5,876 | $355,000 | $69,600 | $285,400 |
| 2023 | $6,856 | $307,300 | $40,000 | $267,300 |
| 2022 | $6,946 | $368,200 | $40,000 | $328,200 |
| 2021 | $6,910 | $270,200 | $40,000 | $230,200 |
| 2020 | $6,926 | $270,200 | $40,000 | $230,200 |
| 2019 | $7,212 | $270,200 | $40,000 | $230,200 |
| 2018 | $6,900 | $294,200 | $40,000 | $254,200 |
| 2017 | $6,900 | $261,700 | $33,774 | $227,926 |
| 2016 | $6,402 | $274,300 | $35,400 | $238,900 |
| 2015 | -- | $259,700 | $33,500 | $226,200 |
Source: Public Records
Map
Nearby Homes
- 1600 West Ln
- 36 Skunk Hollow Rd
- 709 Wildwood Ct
- 0 Hickory Ln
- 604 Hickory Ct
- 812 Bridle Ln
- 440 S 7th St
- 912 S Oak St
- 519 S 2nd St
- 109 N Hill St
- 517 N 3rd St
- 512 N Hill St
- 0 Hill St N
- Lot 7 & 8 Crescent Hills Dr
- 307 N Walnut St
- 726 N 4th St
- 221 N 4th St
- 114 Fireside Ct
- 203 Eagles Bluff Rd
- 348 Regent Dr
- 56 Crescent Ave
- 78 Crescent Ave
- 51 Crescent Ave
- 29 Crescent Ave
- 96 Crescent Ave
- 75 Crescent Ave
- 100 Kinder Rd
- 1529 Claudia Ave
- 1539 Claudia Ave
- 1533 Claudia Ave
- 95 Crescent Ave
- 110 Crescent Ave
- 30 Janell Ave
- 60 Janell Ave
- 1429 1429 County Road 25
- 1543 Claudia Ave
- 1523 Claudia Ave
- 103 Crescent Ave
- 88 Janell Ave
- 102 Kinder Rd
Your Personal Tour Guide
Ask me questions while you tour the home.