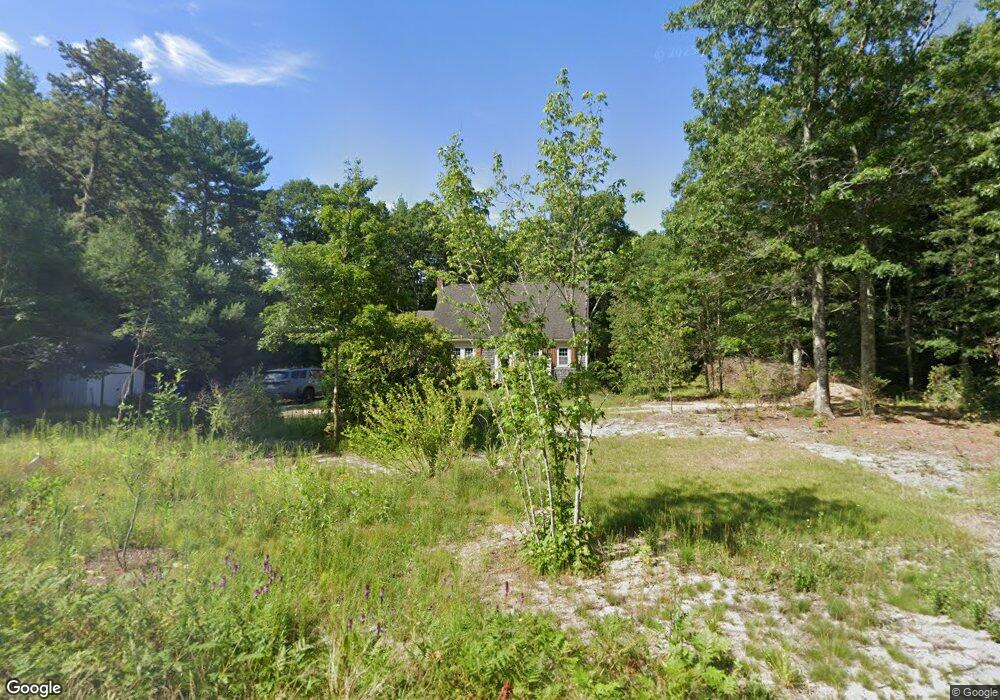
32 Cross Rd Rochester, MA 02770
Estimated Value: $545,000 - $612,000
3
Beds
1
Bath
1,416
Sq Ft
$414/Sq Ft
Est. Value
About This Home
This home is located at 32 Cross Rd, Rochester, MA 02770 and is currently estimated at $586,206, approximately $413 per square foot. 32 Cross Rd is a home located in Plymouth County with nearby schools including Rochester Memorial School and Old Rochester Regional High School.
Ownership History
Date
Name
Owned For
Owner Type
Purchase Details
Closed on
Nov 18, 2020
Sold by
Freeman Ft
Bought by
Freeman Laura D
Current Estimated Value
Purchase Details
Closed on
Aug 7, 2020
Sold by
Beverly A Pierce T
Bought by
Pierce Bradford E
Purchase Details
Closed on
Aug 19, 2019
Sold by
Beverly A Pierce T
Bought by
Pierce Bradford E
Purchase Details
Closed on
Feb 1, 2007
Sold by
Pierce Beverly A
Bought by
Beverly A Pierce T
Create a Home Valuation Report for This Property
The Home Valuation Report is an in-depth analysis detailing your home's value as well as a comparison with similar homes in the area
Home Values in the Area
Average Home Value in this Area
Purchase History
| Date | Buyer | Sale Price | Title Company |
|---|---|---|---|
| Freeman Laura D | -- | None Available | |
| Pierce Bradford E | -- | None Available | |
| Pierce Bradford E | -- | -- | |
| Beverly A Pierce T | -- | -- |
Source: Public Records
Mortgage History
| Date | Status | Borrower | Loan Amount |
|---|---|---|---|
| Previous Owner | Beverly A Pierce T | $101,000 | |
| Previous Owner | Beverly A Pierce T | $120,000 | |
| Previous Owner | Beverly A Pierce T | $44,000 |
Source: Public Records
Tax History Compared to Growth
Tax History
| Year | Tax Paid | Tax Assessment Tax Assessment Total Assessment is a certain percentage of the fair market value that is determined by local assessors to be the total taxable value of land and additions on the property. | Land | Improvement |
|---|---|---|---|---|
| 2025 | $5,375 | $496,800 | $180,900 | $315,900 |
| 2024 | $5,276 | $477,000 | $172,300 | $304,700 |
| 2023 | $5,131 | $432,300 | $172,300 | $260,000 |
| 2022 | $5,025 | $394,400 | $205,500 | $188,900 |
| 2021 | $4,905 | $366,900 | $193,500 | $173,400 |
| 2020 | $4,785 | $355,000 | $187,500 | $167,500 |
| 2019 | $4,192 | $299,400 | $176,400 | $123,000 |
| 2018 | $4,110 | $291,300 | $159,400 | $131,900 |
| 2017 | $4,041 | $280,800 | $158,300 | $122,500 |
| 2016 | $3,931 | $280,600 | $159,500 | $121,100 |
| 2015 | $3,852 | $273,800 | $159,500 | $114,300 |
| 2014 | $3,787 | $273,400 | $154,900 | $118,500 |
Source: Public Records
Map
Nearby Homes