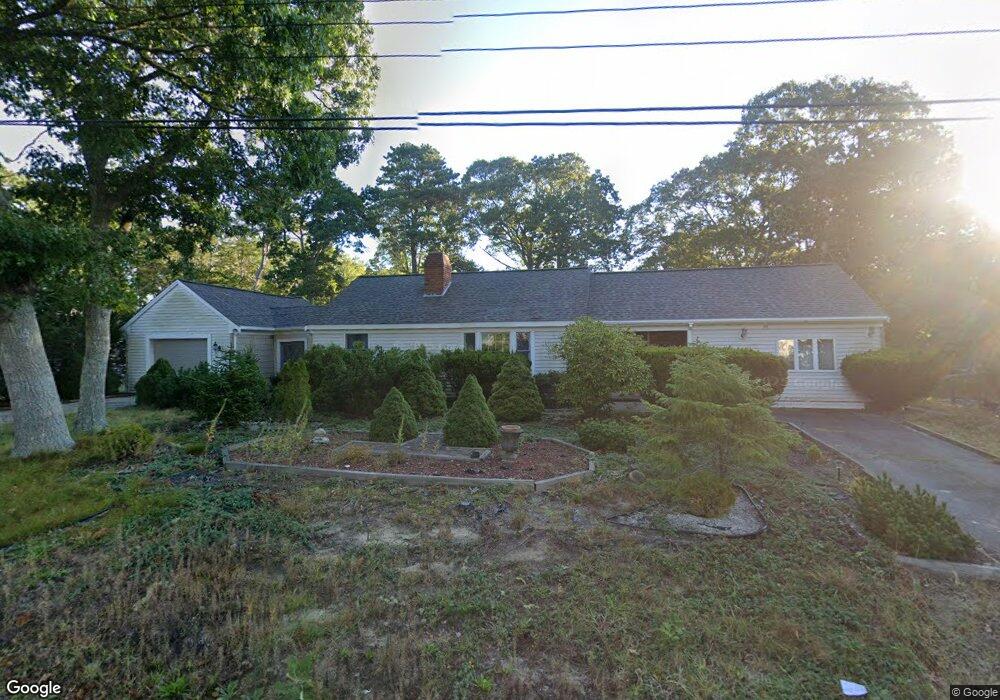
32 Davis Rd South Yarmouth, MA 02664
Estimated Value: $527,000 - $646,000
3
Beds
2
Baths
1,501
Sq Ft
$402/Sq Ft
Est. Value
About This Home
This home is located at 32 Davis Rd, South Yarmouth, MA 02664 and is currently estimated at $603,895, approximately $402 per square foot. 32 Davis Rd is a home located in Barnstable County with nearby schools including Dennis-Yarmouth Regional High School and St. Pius X. School.
Ownership History
Date
Name
Owned For
Owner Type
Purchase Details
Closed on
Jul 24, 2009
Sold by
Wolfgram Alvin G and Savitsky Linda R
Bought by
Wolfgram Alvin G
Current Estimated Value
Purchase Details
Closed on
Jun 10, 2002
Sold by
Cardillo Charles J and Cardillo Wendie C
Bought by
Wolfgram Alvin G and Savitsky Linda R
Home Financials for this Owner
Home Financials are based on the most recent Mortgage that was taken out on this home.
Original Mortgage
$198,300
Interest Rate
6.9%
Mortgage Type
Purchase Money Mortgage
Purchase Details
Closed on
Jun 24, 1988
Sold by
Mccormack Patrick J
Bought by
Candillo Charles J
Create a Home Valuation Report for This Property
The Home Valuation Report is an in-depth analysis detailing your home's value as well as a comparison with similar homes in the area
Home Values in the Area
Average Home Value in this Area
Purchase History
| Date | Buyer | Sale Price | Title Company |
|---|---|---|---|
| Wolfgram Alvin G | -- | -- | |
| Wolfgram Alvin G | $247,900 | -- | |
| Candillo Charles J | $143,000 | -- |
Source: Public Records
Mortgage History
| Date | Status | Borrower | Loan Amount |
|---|---|---|---|
| Previous Owner | Wolfgram Alvin G | $198,300 |
Source: Public Records
Tax History Compared to Growth
Tax History
| Year | Tax Paid | Tax Assessment Tax Assessment Total Assessment is a certain percentage of the fair market value that is determined by local assessors to be the total taxable value of land and additions on the property. | Land | Improvement |
|---|---|---|---|---|
| 2025 | $3,629 | $512,500 | $165,700 | $346,800 |
| 2024 | $3,417 | $463,000 | $144,100 | $318,900 |
| 2023 | $3,363 | $414,700 | $131,000 | $283,700 |
| 2022 | $3,227 | $351,500 | $125,000 | $226,500 |
| 2021 | $3,036 | $317,600 | $125,000 | $192,600 |
| 2020 | $3,112 | $311,200 | $132,300 | $178,900 |
| 2019 | $2,880 | $285,100 | $132,300 | $152,800 |
| 2018 | $2,706 | $263,000 | $110,200 | $152,800 |
| 2017 | $2,635 | $263,000 | $110,200 | $152,800 |
| 2016 | $2,537 | $254,200 | $101,400 | $152,800 |
| 2015 | $2,378 | $236,900 | $97,000 | $139,900 |
Source: Public Records
Map
Nearby Homes