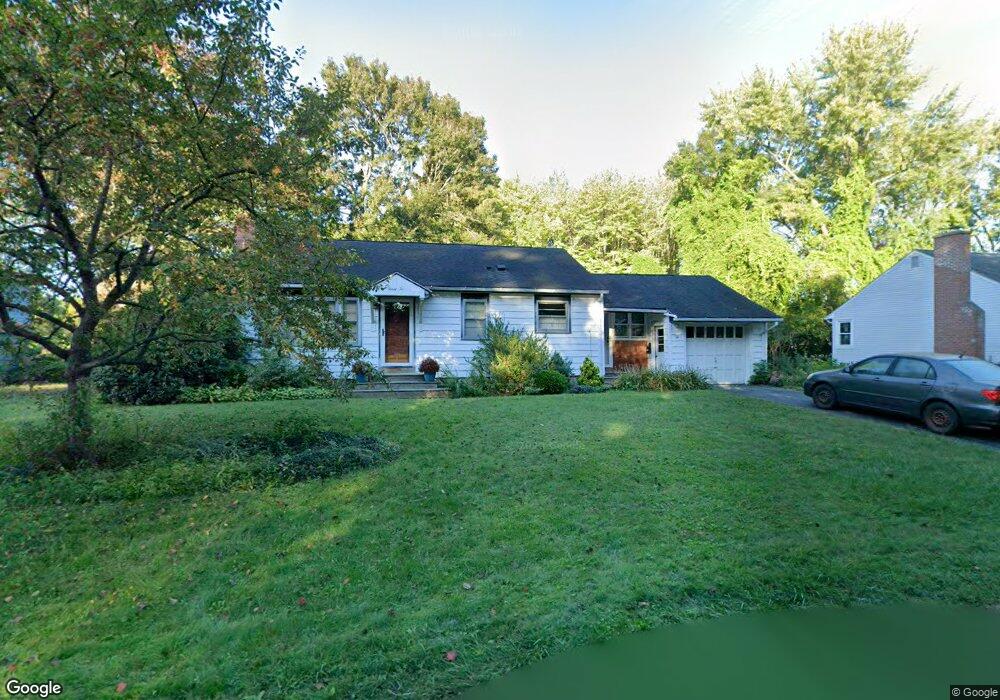
32 Denise Ct Northampton, MA 01060
Estimated Value: $380,000 - $490,000
2
Beds
1
Bath
1,008
Sq Ft
$425/Sq Ft
Est. Value
About This Home
This home is located at 32 Denise Ct, Northampton, MA 01060 and is currently estimated at $428,313, approximately $424 per square foot. 32 Denise Ct is a home located in Hampshire County with nearby schools including Northampton High School, The Montessori School of Northampton, and Lander Grinspoon Academy.
Ownership History
Date
Name
Owned For
Owner Type
Purchase Details
Closed on
May 26, 2006
Sold by
Bak Anthony
Bought by
Ragland Janice G
Current Estimated Value
Home Financials for this Owner
Home Financials are based on the most recent Mortgage that was taken out on this home.
Original Mortgage
$160,000
Outstanding Balance
$93,856
Interest Rate
6.53%
Mortgage Type
Purchase Money Mortgage
Estimated Equity
$334,457
Create a Home Valuation Report for This Property
The Home Valuation Report is an in-depth analysis detailing your home's value as well as a comparison with similar homes in the area
Home Values in the Area
Average Home Value in this Area
Purchase History
| Date | Buyer | Sale Price | Title Company |
|---|---|---|---|
| Ragland Janice G | $220,000 | -- |
Source: Public Records
Mortgage History
| Date | Status | Borrower | Loan Amount |
|---|---|---|---|
| Open | Ragland Janice G | $160,000 |
Source: Public Records
Tax History Compared to Growth
Tax History
| Year | Tax Paid | Tax Assessment Tax Assessment Total Assessment is a certain percentage of the fair market value that is determined by local assessors to be the total taxable value of land and additions on the property. | Land | Improvement |
|---|---|---|---|---|
| 2025 | $5,208 | $373,900 | $184,100 | $189,800 |
| 2024 | $4,226 | $278,200 | $167,500 | $110,700 |
| 2023 | $4,665 | $294,500 | $152,200 | $142,300 |
| 2022 | $4,453 | $248,900 | $142,300 | $106,600 |
| 2021 | $4,084 | $235,100 | $135,600 | $99,500 |
| 2020 | $3,950 | $235,100 | $135,600 | $99,500 |
| 2019 | $3,960 | $228,000 | $135,600 | $92,400 |
| 2018 | $3,829 | $224,700 | $135,600 | $89,100 |
| 2017 | $3,750 | $224,700 | $135,600 | $89,100 |
| 2016 | $3,631 | $224,700 | $135,600 | $89,100 |
| 2015 | $3,320 | $210,100 | $120,600 | $89,500 |
| 2014 | $3,233 | $210,100 | $120,600 | $89,500 |
Source: Public Records
Map
Nearby Homes
- 74 Barrett St Unit 105
- 4 Gleason Rd
- 76 Cooke Ave
- 16 Taylor St
- 206 Prospect St
- 103 Massasoit St
- 5 Prospect Ct
- 13 1/2 Finn St
- 8 View Ave Unit A
- 8 View Ave Unit B
- 37 Finn St
- 76 Crescent St Unit 2
- 51 1/2 Hatfield St Unit 6
- 215 State St
- 59 Day Ave
- 0 Terrace Ln
- 14 Arlington St
- 50 Walnut St
- 9 Walnut St Unit B
- 30 Cherry St