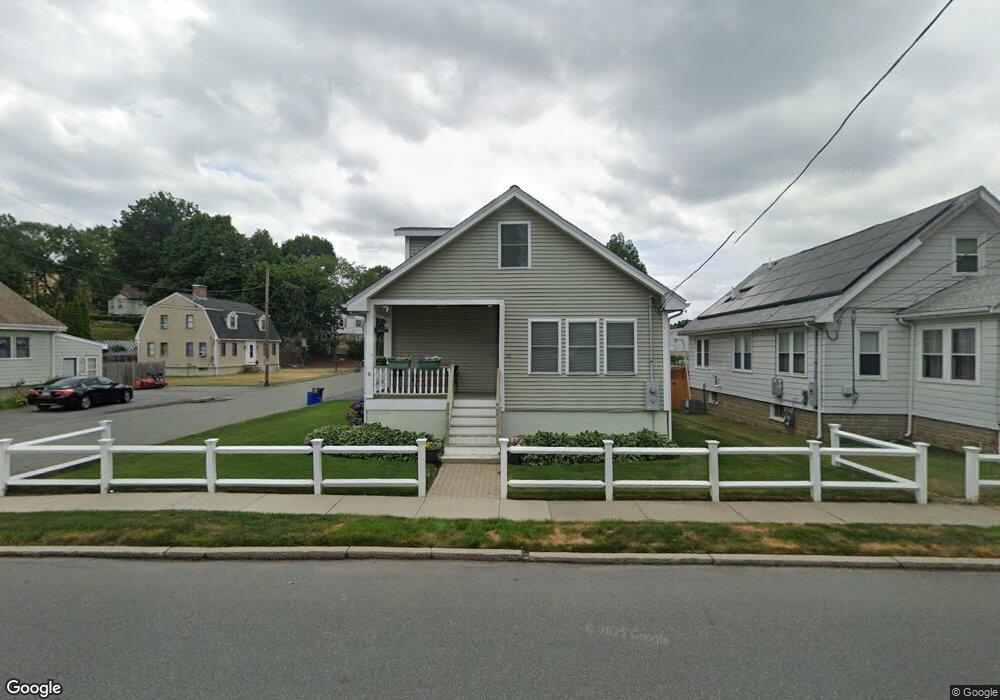
32 Denver St Saugus, MA 01906
Pleasant Hills NeighborhoodEstimated Value: $783,000 - $1,001,000
4
Beds
2
Baths
2,929
Sq Ft
$306/Sq Ft
Est. Value
About This Home
This home is located at 32 Denver St, Saugus, MA 01906 and is currently estimated at $895,083, approximately $305 per square foot. 32 Denver St is a home located in Essex County with nearby schools including Saugus High School, Pioneer Charter School Of Science II, and Sacred Heart School.
Ownership History
Date
Name
Owned For
Owner Type
Purchase Details
Closed on
Oct 16, 2003
Sold by
Beauchamp Richard A
Bought by
Cummings James A
Current Estimated Value
Purchase Details
Closed on
Aug 28, 2002
Sold by
Lebow Selma L and Goodman Rhonda L
Bought by
Beauchamp Richard A
Create a Home Valuation Report for This Property
The Home Valuation Report is an in-depth analysis detailing your home's value as well as a comparison with similar homes in the area
Home Values in the Area
Average Home Value in this Area
Purchase History
| Date | Buyer | Sale Price | Title Company |
|---|---|---|---|
| Cummings James A | $504,000 | -- | |
| Beauchamp Richard A | $199,000 | -- |
Source: Public Records
Mortgage History
| Date | Status | Borrower | Loan Amount |
|---|---|---|---|
| Open | Beauchamp Richard A | $110,000 | |
| Closed | Beauchamp Richard A | $100,000 | |
| Closed | Beauchamp Richard A | $100,000 |
Source: Public Records
Tax History Compared to Growth
Tax History
| Year | Tax Paid | Tax Assessment Tax Assessment Total Assessment is a certain percentage of the fair market value that is determined by local assessors to be the total taxable value of land and additions on the property. | Land | Improvement |
|---|---|---|---|---|
| 2025 | $8,578 | $803,200 | $312,400 | $490,800 |
| 2024 | $8,274 | $776,900 | $294,600 | $482,300 |
| 2023 | $8,118 | $721,000 | $258,900 | $462,100 |
| 2022 | $7,815 | $650,700 | $237,400 | $413,300 |
| 2021 | $7,460 | $604,500 | $206,200 | $398,300 |
| 2020 | $6,934 | $581,700 | $196,400 | $385,300 |
| 2019 | $6,726 | $552,200 | $178,500 | $373,700 |
| 2018 | $5,996 | $517,800 | $173,200 | $344,600 |
| 2017 | $5,516 | $457,800 | $161,600 | $296,200 |
| 2016 | $4,627 | $379,300 | $161,300 | $218,000 |
| 2015 | $4,342 | $361,200 | $153,600 | $207,600 |
| 2014 | $4,486 | $386,400 | $153,600 | $232,800 |
Source: Public Records
Map
Nearby Homes