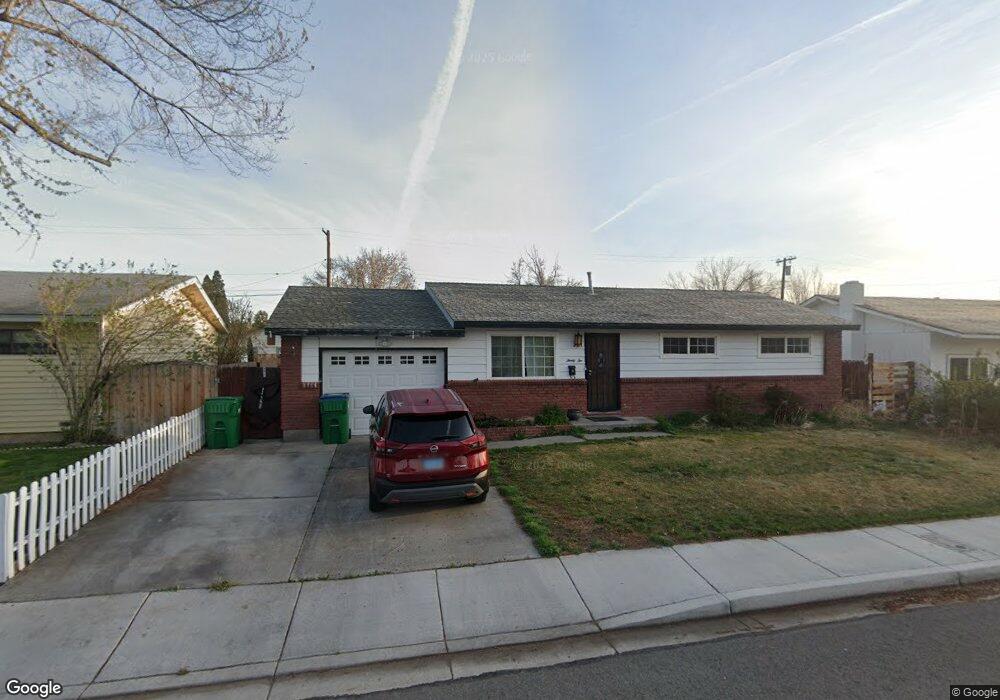
32 E Devere Way Sparks, NV 89431
McCarran Boulevard-Probasco NeighborhoodEstimated Value: $383,000 - $435,000
3
Beds
1
Bath
988
Sq Ft
$405/Sq Ft
Est. Value
About This Home
This home is located at 32 E Devere Way, Sparks, NV 89431 and is currently estimated at $399,837, approximately $404 per square foot. 32 E Devere Way is a home located in Washoe County with nearby schools including Florence Drake Elementary School, George L Dilworth Middle School, and Sparks High School.
Ownership History
Date
Name
Owned For
Owner Type
Purchase Details
Closed on
Sep 27, 2002
Sold by
Cervantes Jose T and Cervantes Eloisa
Bought by
Cervantes Jose T and Cervantes Eloisa
Current Estimated Value
Home Financials for this Owner
Home Financials are based on the most recent Mortgage that was taken out on this home.
Original Mortgage
$94,300
Interest Rate
6.16%
Purchase Details
Closed on
Jul 10, 1998
Sold by
Westfall Alison S and Westfall David P
Bought by
Cervantes Jose R and Cervantes Eloisa
Home Financials for this Owner
Home Financials are based on the most recent Mortgage that was taken out on this home.
Original Mortgage
$105,317
Interest Rate
7%
Mortgage Type
FHA
Purchase Details
Closed on
Jul 20, 1995
Sold by
Zofrea John J and Zofrea Joan M
Bought by
Westfall Alison S and Westfall David P
Home Financials for this Owner
Home Financials are based on the most recent Mortgage that was taken out on this home.
Original Mortgage
$81,600
Interest Rate
7.59%
Create a Home Valuation Report for This Property
The Home Valuation Report is an in-depth analysis detailing your home's value as well as a comparison with similar homes in the area
Home Values in the Area
Average Home Value in this Area
Purchase History
| Date | Buyer | Sale Price | Title Company |
|---|---|---|---|
| Cervantes Jose T | $94,000 | Western Title Inc | |
| Cervantes Jose R | $108,000 | First American Title Co | |
| Westfall Alison S | $102,000 | Founders Title Co |
Source: Public Records
Mortgage History
| Date | Status | Borrower | Loan Amount |
|---|---|---|---|
| Closed | Cervantes Jose T | $94,300 | |
| Closed | Cervantes Jose R | $105,317 | |
| Previous Owner | Westfall Alison S | $81,600 |
Source: Public Records
Tax History Compared to Growth
Tax History
| Year | Tax Paid | Tax Assessment Tax Assessment Total Assessment is a certain percentage of the fair market value that is determined by local assessors to be the total taxable value of land and additions on the property. | Land | Improvement |
|---|---|---|---|---|
| 2025 | $652 | $49,296 | $33,565 | $15,731 |
| 2024 | $652 | $45,560 | $30,065 | $15,495 |
| 2023 | $634 | $45,649 | $31,325 | $14,324 |
| 2022 | $615 | $37,835 | $26,180 | $11,655 |
| 2021 | $598 | $29,223 | $17,955 | $11,268 |
| 2020 | $579 | $28,106 | $16,940 | $11,166 |
| 2019 | $562 | $26,433 | $15,890 | $10,543 |
| 2018 | $546 | $21,855 | $11,725 | $10,130 |
| 2017 | $530 | $20,475 | $10,395 | $10,080 |
| 2016 | $517 | $19,443 | $9,345 | $10,098 |
| 2015 | $132 | $17,613 | $7,700 | $9,913 |
| 2014 | $501 | $15,776 | $6,440 | $9,336 |
| 2013 | -- | $13,342 | $4,270 | $9,072 |
Source: Public Records
Map
Nearby Homes
- 10 Sheridan Way
- 119 Devere Way
- 120 E Lenwood Dr
- 2865 Patrice Dr
- 3071 Meadowlands Dr
- 3245 Elaine Way
- 3104 Sandy St
- 465 Lenwood Dr
- 8 E O St
- 1940 4th St Unit 20
- 1940 4th St Unit 51
- 707 Glen Meadow Dr
- 1703 1st St
- 745 Glen Vista Dr
- 1945 4th St Unit 32
- 1945 4th St Unit 33
- 1945 4th St Unit 10
- 3167 Bristle Branch Dr
- 3188 Bristle Branch Dr
- 3198 Bristle Branch Dr
- 36 E Devere Way
- 28 E Devere Way
- 29 E Gault Way
- 35 E Gault Way
- 25 E Gault Way
- 40 E Devere Way
- 24 E Devere Way
- 35 E Devere Way
- 23 E Gault Way
- 39 E Gault Way
- 25 E Devere Way
- 50 E Devere Way
- 59 E Gault Way
- 19 E Gault Way
- 23 E Devere Way
- 2790 Lennox Ln
- 20 Amberley Way
- 16 E Devere Way
- 30 E Gault Way
- 26 E Gault Way