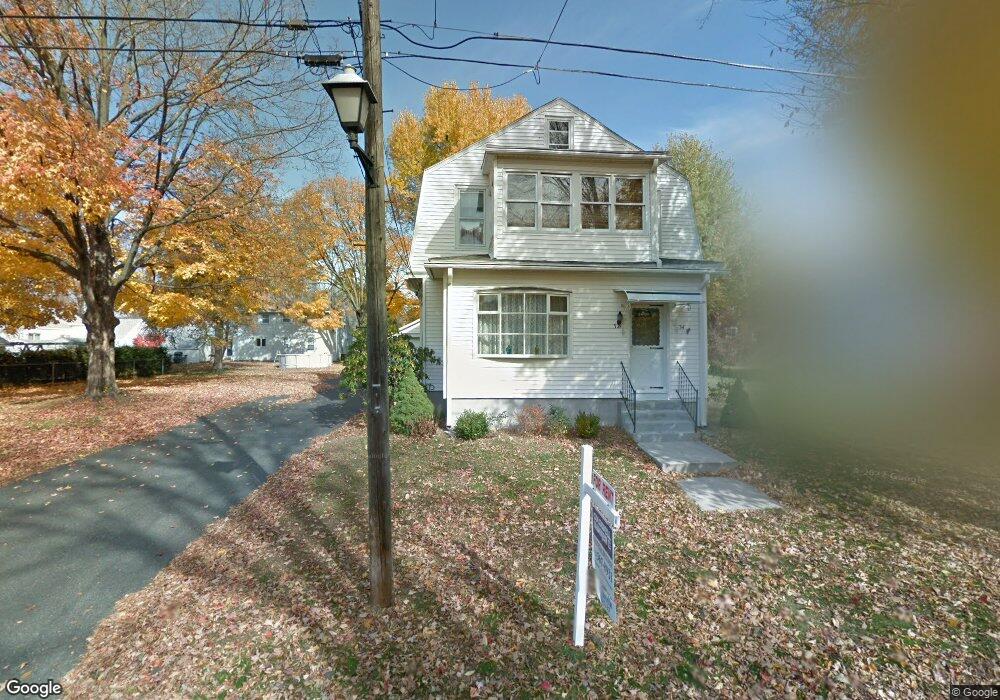
32 Elm Ave Unit 32 Longmeadow, MA 01106
Estimated Value: $397,262 - $610,000
2
Beds
1
Bath
2,246
Sq Ft
$205/Sq Ft
Est. Value
About This Home
This home is located at 32 Elm Ave Unit 32, Longmeadow, MA 01106 and is currently estimated at $460,566, approximately $205 per square foot. 32 Elm Ave Unit 32 is a home located in Hampden County with nearby schools including Wolf Swamp Road School, Glenbrook Middle School, and Longmeadow High School.
Ownership History
Date
Name
Owned For
Owner Type
Purchase Details
Closed on
Dec 30, 2016
Sold by
Selden Janice C and Donaldson Wayne A
Bought by
Maziarz Jean F and Maziarz Peter R
Current Estimated Value
Home Financials for this Owner
Home Financials are based on the most recent Mortgage that was taken out on this home.
Original Mortgage
$192,750
Outstanding Balance
$158,021
Interest Rate
3.94%
Mortgage Type
New Conventional
Estimated Equity
$302,545
Purchase Details
Closed on
May 22, 2013
Sold by
Donaldson John S
Bought by
Donaldson John S and Donaldson Wayne A
Create a Home Valuation Report for This Property
The Home Valuation Report is an in-depth analysis detailing your home's value as well as a comparison with similar homes in the area
Home Values in the Area
Average Home Value in this Area
Purchase History
| Date | Buyer | Sale Price | Title Company |
|---|---|---|---|
| Maziarz Jean F | $257,000 | -- | |
| Donaldson John S | -- | -- |
Source: Public Records
Mortgage History
| Date | Status | Borrower | Loan Amount |
|---|---|---|---|
| Open | Maziarz Jean F | $192,750 |
Source: Public Records
Tax History Compared to Growth
Tax History
| Year | Tax Paid | Tax Assessment Tax Assessment Total Assessment is a certain percentage of the fair market value that is determined by local assessors to be the total taxable value of land and additions on the property. | Land | Improvement |
|---|---|---|---|---|
| 2025 | $6,598 | $312,400 | $145,400 | $167,000 |
| 2024 | $6,494 | $314,000 | $145,400 | $168,600 |
| 2023 | $5,975 | $260,700 | $117,200 | $143,500 |
| 2022 | $5,891 | $239,100 | $117,200 | $121,900 |
| 2021 | $6,131 | $247,800 | $118,600 | $129,200 |
| 2020 | $5,827 | $240,700 | $111,500 | $129,200 |
| 2019 | $5,977 | $248,100 | $111,500 | $136,600 |
| 2018 | $5,859 | $240,700 | $130,500 | $110,200 |
| 2017 | $5,537 | $234,800 | $130,500 | $104,300 |
| 2016 | $5,503 | $226,200 | $123,500 | $102,700 |
| 2015 | $5,388 | $228,100 | $122,300 | $105,800 |
Source: Public Records
Map
Nearby Homes