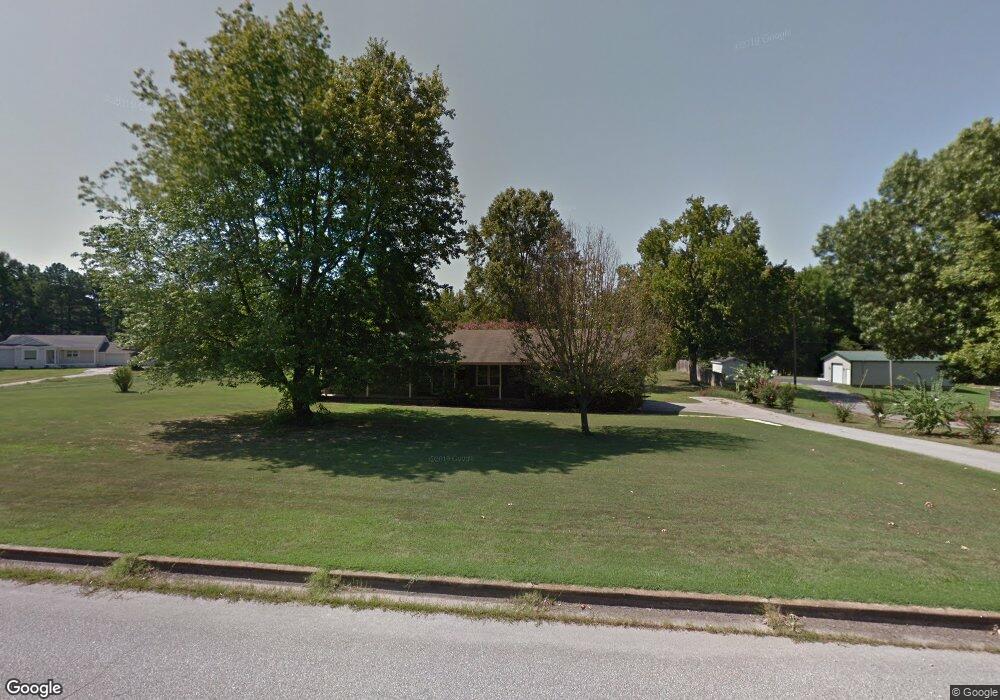
32 Enger Rd Humboldt, TN 38343
Estimated Value: $149,000 - $188,000
--
Bed
2
Baths
1,640
Sq Ft
$104/Sq Ft
Est. Value
About This Home
This home is located at 32 Enger Rd, Humboldt, TN 38343 and is currently estimated at $170,839, approximately $104 per square foot. 32 Enger Rd is a home located in Gibson County with nearby schools including South Gibson County Elementary School, South Gibson County Middle School, and South Gibson County High School.
Ownership History
Date
Name
Owned For
Owner Type
Purchase Details
Closed on
Mar 26, 2021
Sold by
Duncan Carissa C
Bought by
Mclemore Amy
Current Estimated Value
Purchase Details
Closed on
May 14, 2013
Sold by
Gillespie Marlon Gene
Bought by
Duncan Carissa C
Home Financials for this Owner
Home Financials are based on the most recent Mortgage that was taken out on this home.
Original Mortgage
$76,530
Interest Rate
3.42%
Mortgage Type
Commercial
Purchase Details
Closed on
Nov 10, 2011
Sold by
Gillespie Tammie
Bought by
Gillespie Marlon Gene
Home Financials for this Owner
Home Financials are based on the most recent Mortgage that was taken out on this home.
Original Mortgage
$50,200
Interest Rate
4.17%
Mortgage Type
Commercial
Purchase Details
Closed on
Apr 15, 1993
Bought by
Gillespie Marlon Gene and Gillespie Tammie
Purchase Details
Closed on
Jan 1, 1980
Purchase Details
Closed on
Jan 3, 1900
Bought by
Mays Teddy and Mays Lisa
Purchase Details
Closed on
Jan 2, 1900
Create a Home Valuation Report for This Property
The Home Valuation Report is an in-depth analysis detailing your home's value as well as a comparison with similar homes in the area
Home Values in the Area
Average Home Value in this Area
Purchase History
| Date | Buyer | Sale Price | Title Company |
|---|---|---|---|
| Mclemore Amy | $71,251 | None Available | |
| Mclemore Amy | $71,250 | Patterson Charles | |
| Duncan Carissa C | $75,000 | -- | |
| Gillespie Marlon Gene | -- | -- | |
| Gillespie Marlon Gene | $63,500 | -- | |
| -- | $42,000 | -- | |
| Mays Teddy | -- | -- | |
| -- | -- | -- |
Source: Public Records
Mortgage History
| Date | Status | Borrower | Loan Amount |
|---|---|---|---|
| Previous Owner | Duncan Carissa C | $76,530 | |
| Previous Owner | Gillespie Marlon Gene | $50,200 |
Source: Public Records
Tax History Compared to Growth
Tax History
| Year | Tax Paid | Tax Assessment Tax Assessment Total Assessment is a certain percentage of the fair market value that is determined by local assessors to be the total taxable value of land and additions on the property. | Land | Improvement |
|---|---|---|---|---|
| 2025 | $977 | $45,500 | $0 | $0 |
| 2024 | $977 | $45,500 | $3,750 | $41,750 |
| 2023 | $694 | $22,275 | $2,500 | $19,775 |
| 2022 | $678 | $22,275 | $2,500 | $19,775 |
| 2021 | $678 | $22,275 | $2,500 | $19,775 |
| 2020 | $678 | $22,275 | $2,500 | $19,775 |
| 2019 | $678 | $22,275 | $2,500 | $19,775 |
| 2018 | $713 | $22,550 | $2,500 | $20,050 |
| 2017 | $701 | $22,550 | $2,500 | $20,050 |
| 2016 | $701 | $22,550 | $2,500 | $20,050 |
| 2015 | -- | $22,550 | $2,500 | $20,050 |
| 2014 | -- | $22,550 | $2,500 | $20,050 |
Source: Public Records
Map
Nearby Homes
- 0 Trenton Hwy
- 99 Fruitland Rd
- 00 Mag Duffy St
- 290 Tennessee 420
- 00 N Central Ave
- 1532 Mag Duffy St
- 2834 N Central Ave
- 2820 N Central Ave
- 116 Gale Faucett Rd
- 195 Old Jackson Rd
- 2998 N Central Ave
- 00 Central Ave
- 0 Viking Dr
- 0 Harpers Chapel Rd
- 1730 Stallings Rd
- 0 Highway 45 Bypass
- 00 Humboldt Gibson Hwy
- 36 Casey Rd
- 3112 Doe Trail Cove
- 340 Gibson Hwy