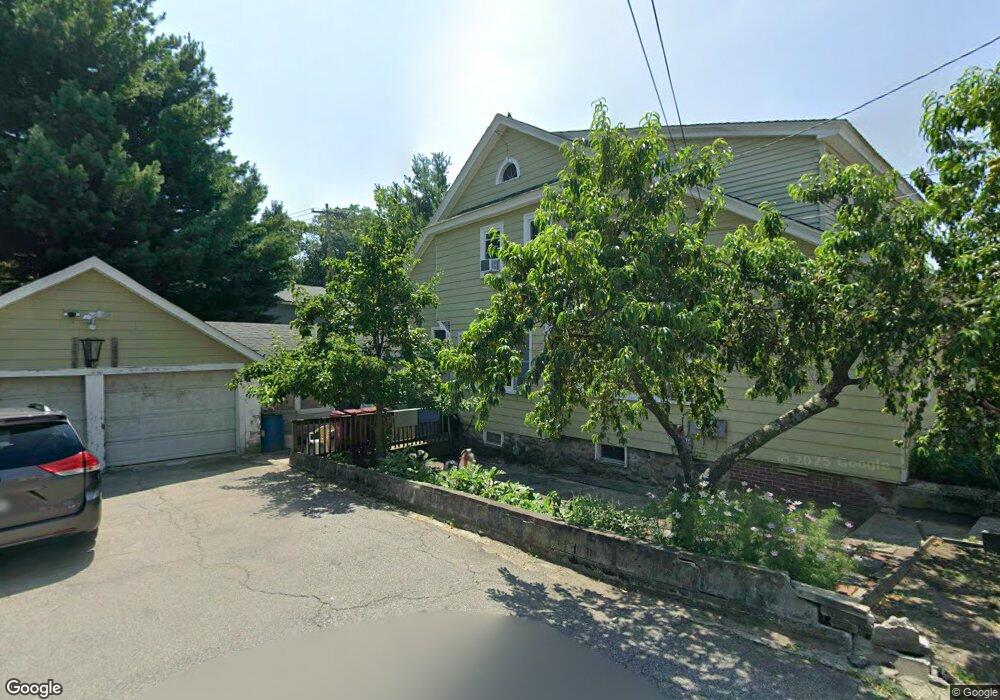
32 England St Lowell, MA 01852
South Lowell NeighborhoodEstimated Value: $600,915 - $728,000
7
Beds
2
Baths
2,250
Sq Ft
$294/Sq Ft
Est. Value
About This Home
This home is located at 32 England St, Lowell, MA 01852 and is currently estimated at $661,979, approximately $294 per square foot. 32 England St is a home located in Middlesex County with nearby schools including Moody Elementary School, Abraham Lincoln Elementary School, and Greenhalge Elementary School.
Ownership History
Date
Name
Owned For
Owner Type
Purchase Details
Closed on
Aug 1, 2002
Sold by
Tak Chhoun and Tak Oeun
Bought by
Nha Chhoeu and Chhoeu Nha
Current Estimated Value
Home Financials for this Owner
Home Financials are based on the most recent Mortgage that was taken out on this home.
Original Mortgage
$220,005
Outstanding Balance
$93,694
Interest Rate
6.64%
Mortgage Type
Purchase Money Mortgage
Estimated Equity
$568,285
Purchase Details
Closed on
Feb 25, 1994
Sold by
Fhlmc
Bought by
Tak Oeun and Tak Nha Chhoun
Purchase Details
Closed on
Jun 10, 1993
Sold by
Meneus Louis L and Federal Home Loan Mortgage Cor
Bought by
Fhlmc
Purchase Details
Closed on
Apr 6, 1990
Sold by
Hampton Falls Dev
Bought by
Meneus Louis L
Purchase Details
Closed on
Dec 23, 1988
Sold by
Narbonne M Harriet
Bought by
Hampton Falls Dev
Create a Home Valuation Report for This Property
The Home Valuation Report is an in-depth analysis detailing your home's value as well as a comparison with similar homes in the area
Home Values in the Area
Average Home Value in this Area
Purchase History
| Date | Buyer | Sale Price | Title Company |
|---|---|---|---|
| Nha Chhoeu | $244,450 | -- | |
| Nha Chhoeu | $244,450 | -- | |
| Tak Oeun | $88,500 | -- | |
| Tak Oeun | $88,500 | -- | |
| Fhlmc | $63,750 | -- | |
| Fhlmc | $63,750 | -- | |
| Meneus Louis L | $165,000 | -- | |
| Meneus Louis L | $165,000 | -- | |
| Hampton Falls Dev | $170,000 | -- |
Source: Public Records
Mortgage History
| Date | Status | Borrower | Loan Amount |
|---|---|---|---|
| Open | Hampton Falls Dev | $220,005 | |
| Closed | Hampton Falls Dev | $220,005 |
Source: Public Records
Tax History
| Year | Tax Paid | Tax Assessment Tax Assessment Total Assessment is a certain percentage of the fair market value that is determined by local assessors to be the total taxable value of land and additions on the property. | Land | Improvement |
|---|---|---|---|---|
| 2025 | $6,377 | $555,500 | $170,100 | $385,400 |
| 2024 | $5,949 | $499,500 | $159,000 | $340,500 |
| 2023 | $5,517 | $444,200 | $138,300 | $305,900 |
| 2022 | $5,105 | $402,300 | $125,700 | $276,600 |
| 2021 | $4,731 | $351,500 | $109,400 | $242,100 |
| 2020 | $4,371 | $327,200 | $104,000 | $223,200 |
| 2019 | $4,100 | $292,000 | $96,300 | $195,700 |
| 2018 | $3,842 | $267,000 | $91,800 | $175,200 |
| 2017 | $3,629 | $243,200 | $83,400 | $159,800 |
| 2016 | $3,649 | $240,700 | $72,900 | $167,800 |
| 2015 | $3,393 | $219,200 | $72,900 | $146,300 |
| 2013 | $3,080 | $205,200 | $81,400 | $123,800 |
Source: Public Records
Map
Nearby Homes
- 22 Juniper St
- 28 Warnock St
- 1204 Lawrence St
- 14 Warnock St
- 74 Felton St Unit A
- 57 Arnold Ave
- 36 Crowley St
- 106 Lundberg St Unit 6
- 900 Lawrence St Unit 5
- 5 Lenox St Unit 2
- 5 Lenox St Unit 4
- 1400 Gorham St Unit 42
- 1400 Gorham St Unit 46
- 810 Lawrence St Unit C
- 21 Agawam St
- 74 Carlisle St
- 471 Butman Rd
- 39 Moore St
- 7 Gorham St Unit 54
- 7 Gorham St Unit 36
Your Personal Tour Guide
Ask me questions while you tour the home.