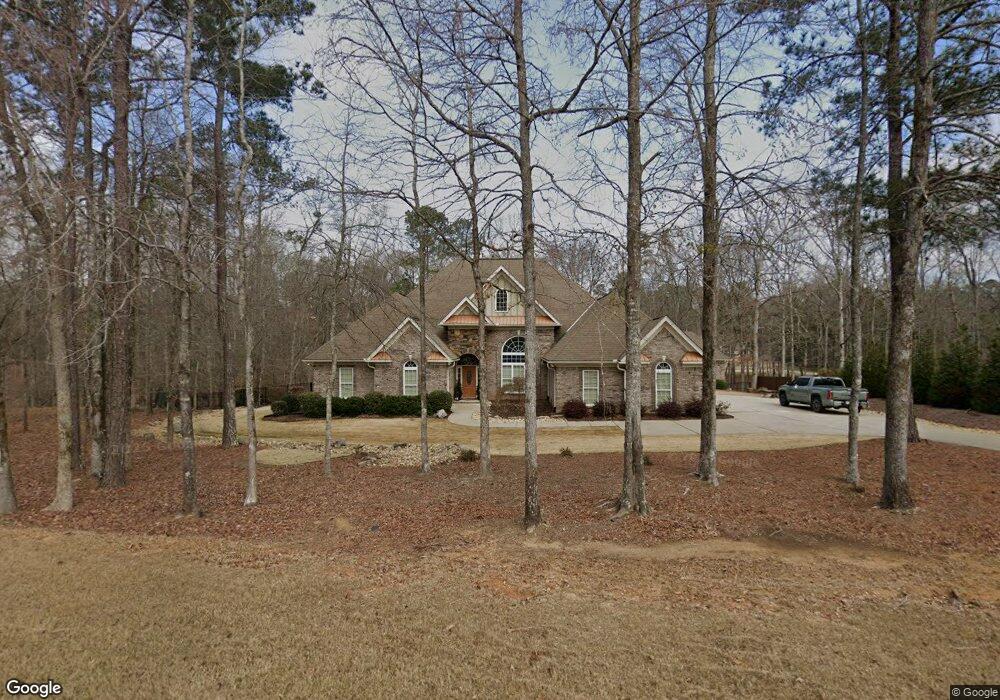
32 Hackberry Ct Cataula, GA 31804
Estimated Value: $503,000 - $871,000
4
Beds
4
Baths
3,296
Sq Ft
$186/Sq Ft
Est. Value
About This Home
This home is located at 32 Hackberry Ct, Cataula, GA 31804 and is currently estimated at $613,616, approximately $186 per square foot. 32 Hackberry Ct is a home with nearby schools including Mulberry Creek Elementary School, Creekside School, and Harris County Carver Middle School.
Ownership History
Date
Name
Owned For
Owner Type
Purchase Details
Closed on
Dec 9, 2016
Sold by
Armstead Floyd C and Armstead Kathy H
Bought by
Cheves Zarina Haider and Cheves Matthew D
Current Estimated Value
Home Financials for this Owner
Home Financials are based on the most recent Mortgage that was taken out on this home.
Original Mortgage
$209,900
Outstanding Balance
$168,410
Interest Rate
3.57%
Mortgage Type
New Conventional
Estimated Equity
$445,206
Purchase Details
Closed on
May 28, 2013
Sold by
Koagel Susan
Bought by
Armstead Floyd and Armstead Kathy
Home Financials for this Owner
Home Financials are based on the most recent Mortgage that was taken out on this home.
Original Mortgage
$209,900
Interest Rate
3.37%
Mortgage Type
New Conventional
Purchase Details
Closed on
May 14, 2010
Sold by
Emfinger David
Bought by
Koagel Susan Oakes and Koagel Anthony J
Home Financials for this Owner
Home Financials are based on the most recent Mortgage that was taken out on this home.
Original Mortgage
$325,000
Interest Rate
3.62%
Mortgage Type
New Conventional
Create a Home Valuation Report for This Property
The Home Valuation Report is an in-depth analysis detailing your home's value as well as a comparison with similar homes in the area
Purchase History
| Date | Buyer | Sale Price | Title Company |
|---|---|---|---|
| Cheves Zarina Haider | $429,900 | -- | |
| Armstead Floyd | $409,900 | -- | |
| Koagel Susan Oakes | $435,000 | -- |
Source: Public Records
Mortgage History
| Date | Status | Borrower | Loan Amount |
|---|---|---|---|
| Open | Cheves Zarina Haider | $209,900 | |
| Previous Owner | Armstead Floyd | $209,900 | |
| Previous Owner | Koagel Susan Oakes | $325,000 |
Source: Public Records
Tax History
| Year | Tax Paid | Tax Assessment Tax Assessment Total Assessment is a certain percentage of the fair market value that is determined by local assessors to be the total taxable value of land and additions on the property. | Land | Improvement |
|---|---|---|---|---|
| 2025 | $5,236 | $191,765 | $22,000 | $169,765 |
| 2024 | $4,871 | $181,157 | $22,000 | $159,157 |
| 2023 | $4,318 | $177,734 | $22,000 | $155,734 |
| 2022 | $4,780 | $177,734 | $22,000 | $155,734 |
| 2021 | $4,808 | $172,409 | $22,000 | $150,409 |
| 2020 | $4,808 | $172,409 | $22,000 | $150,409 |
| 2019 | $4,585 | $170,514 | $22,000 | $148,514 |
| 2018 | $4,679 | $170,514 | $22,000 | $148,514 |
| 2017 | $4,681 | $170,514 | $22,000 | $148,514 |
| 2016 | $3,994 | $159,557 | $22,000 | $137,557 |
| 2015 | $4,091 | $163,157 | $22,000 | $141,157 |
| 2014 | $4,119 | $167,157 | $26,000 | $141,157 |
| 2013 | -- | $167,156 | $26,000 | $141,156 |
Source: Public Records
Map
Nearby Homes
- 0 Kennon Dr Unit 1
- 509 Sweetwater Dr
- 508 Sweetwater Dr
- 218 E East Bonacre Rd
- 595 Grey Rock Dr
- 654 Grey Rock Dr
- 654 Grey Rock Rd
- 9807 N Ivy Park Dr
- 492 Mulberry Crossing Dr
- 4555 Mountain Ivy Dr
- 4559 Mountain Ivy Dr
- 9214 Granite Field Ct
- 172-6 Almond Ridge Dr
- 4554 Mountain Ivy Dr
- 4677 Ivy Patch Dr
- 4586 Wisteria Ln
- 303 Waterford Dr
- 8000 Climbing Ivy Ct
- 9586 English Ivy Ct
- 1278 Jones Rd
- 16 Hackberry Ct
- 21 Hackberry Ct
- 42 Hackberry Ln
- 91 Newberry Ln
- 41 Hackberry Ct
- 81 Hackberry Ln
- 53 Hackberry Ln
- 95 Hackberry Ln
- 98 Hackberry Ln
- 35 Hackberry Ln
- 112 Newberry Ln
- 128 Newberry Ln
- 78 Newberry Ln
- 43 Newberry Ln
- 104 Hackberry Ln
- 42 Newberry Ln
- 134 Newberry Ln
- 33 Newberry Ln
- 20 Newberry Ln
- 462 Little Bear Dr
Your Personal Tour Guide
Ask me questions while you tour the home.