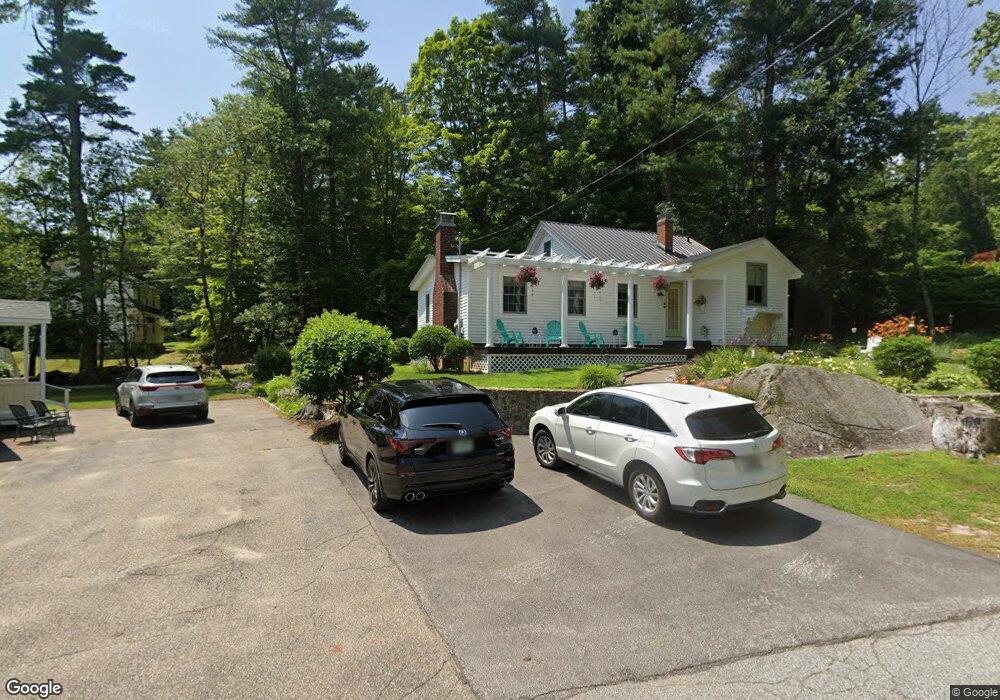
32 Highland St Meredith, NH 03253
Estimated Value: $545,903 - $697,000
3
Beds
2
Baths
1,600
Sq Ft
$407/Sq Ft
Est. Value
About This Home
This home is located at 32 Highland St, Meredith, NH 03253 and is currently estimated at $650,726, approximately $406 per square foot. 32 Highland St is a home located in Belknap County with nearby schools including Inter-Lakes Elementary School and Lakeland School.
Ownership History
Date
Name
Owned For
Owner Type
Purchase Details
Closed on
May 18, 2017
Sold by
Irish Tammy S and Irish John D
Bought by
Tammy S Irish Ret
Current Estimated Value
Purchase Details
Closed on
Aug 1, 2011
Sold by
Mccormack Mary Ellen
Bought by
Irish Tammy S and Irish John D
Purchase Details
Closed on
Jul 21, 2005
Sold by
Milligan Richard D
Bought by
Wargo Mary E
Home Financials for this Owner
Home Financials are based on the most recent Mortgage that was taken out on this home.
Original Mortgage
$100,000
Interest Rate
5.59%
Mortgage Type
Purchase Money Mortgage
Create a Home Valuation Report for This Property
The Home Valuation Report is an in-depth analysis detailing your home's value as well as a comparison with similar homes in the area
Home Values in the Area
Average Home Value in this Area
Purchase History
| Date | Buyer | Sale Price | Title Company |
|---|---|---|---|
| Tammy S Irish Ret | -- | -- | |
| Irish Tammy S | $225,000 | -- | |
| Wargo Mary E | $225,000 | -- | |
| Wargo Mary E | $225,000 | -- |
Source: Public Records
Mortgage History
| Date | Status | Borrower | Loan Amount |
|---|---|---|---|
| Previous Owner | Wargo Mary E | $100,000 |
Source: Public Records
Tax History Compared to Growth
Tax History
| Year | Tax Paid | Tax Assessment Tax Assessment Total Assessment is a certain percentage of the fair market value that is determined by local assessors to be the total taxable value of land and additions on the property. | Land | Improvement |
|---|---|---|---|---|
| 2024 | $4,145 | $404,000 | $157,800 | $246,200 |
| 2023 | $3,996 | $404,000 | $157,800 | $246,200 |
| 2022 | $3,747 | $268,200 | $84,200 | $184,000 |
| 2021 | $3,602 | $268,200 | $84,200 | $184,000 |
| 2020 | $3,760 | $268,200 | $84,200 | $184,000 |
| 2019 | $5,248 | $217,600 | $53,400 | $164,200 |
| 2018 | $5,087 | $217,600 | $53,400 | $164,200 |
| 2016 | $3,308 | $212,200 | $64,500 | $147,700 |
| 2015 | $3,225 | $212,200 | $64,500 | $147,700 |
| 2014 | $3,147 | $212,200 | $64,500 | $147,700 |
| 2013 | $3,058 | $212,200 | $64,500 | $147,700 |
Source: Public Records
Map
Nearby Homes
- 11 & 12 Highland St
- 15 Highland St
- 12 Highland St
- 11 Highland St
- 8 Water St Unit 2
- 21 Pleasant St
- 7 Mudgett Ave
- 4 Pike Island Rd
- 36 Circle Dr
- 111 Nh Route 25
- 26 Sawmill Shores Rd
- 8 Kelly Ln
- 32 Boynton Rd
- 21 Upper Ladd Hill Rd Unit D
- 21 Upper Ladd Hill Rd Unit A
- 21 Upper Ladd Hill Rd Unit E
- 21 Upper Ladd Hill Rd Unit C
- 21 Upper Ladd Hill Rd Unit B
- 99 Pleasant St
- 142 Nh Route 25