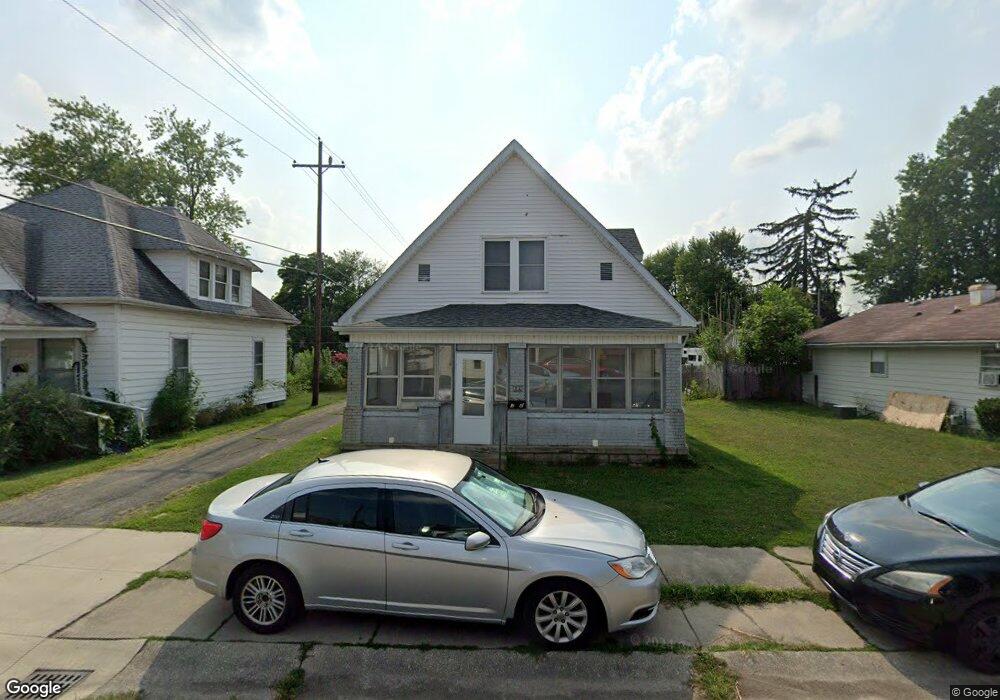
32 Jones St Columbus, IN 47201
Estimated Value: $143,000 - $194,000
3
Beds
2
Baths
2,059
Sq Ft
$87/Sq Ft
Est. Value
About This Home
This home is located at 32 Jones St, Columbus, IN 47201 and is currently estimated at $178,813, approximately $86 per square foot. 32 Jones St is a home located in Bartholomew County with nearby schools including Clifty Creek Elementary School, Central Middle School, and Columbus East High School.
Ownership History
Date
Name
Owned For
Owner Type
Purchase Details
Closed on
Jul 28, 2011
Sold by
Housing Partnerships Inc
Bought by
Hpi Community Housing L P
Current Estimated Value
Purchase Details
Closed on
Nov 9, 2009
Sold by
Mcguire Charles H and Mcguire Mary J
Bought by
Housing Partnerships Inc
Purchase Details
Closed on
Jan 23, 2002
Sold by
Federal National Mortgage Association
Bought by
Mcguire Charles H and Mcguire Mary L
Purchase Details
Closed on
Dec 19, 2001
Sold by
Thompson Troy A and Thompson Sherry
Bought by
Federal National Mortgage Association
Create a Home Valuation Report for This Property
The Home Valuation Report is an in-depth analysis detailing your home's value as well as a comparison with similar homes in the area
Home Values in the Area
Average Home Value in this Area
Purchase History
| Date | Buyer | Sale Price | Title Company |
|---|---|---|---|
| Hpi Community Housing L P | $92,693 | Meridian Title Corporation | |
| Hpi Community Housing Lp | $92,693 | -- | |
| Housing Partnerships Inc | -- | Attorney | |
| Mcguire Charles H | -- | -- | |
| Federal National Mortgage Association | -- | -- |
Source: Public Records
Tax History Compared to Growth
Tax History
| Year | Tax Paid | Tax Assessment Tax Assessment Total Assessment is a certain percentage of the fair market value that is determined by local assessors to be the total taxable value of land and additions on the property. | Land | Improvement |
|---|---|---|---|---|
| 2024 | $2,923 | $130,000 | $14,600 | $115,400 |
| 2023 | $2,837 | $122,100 | $16,400 | $105,700 |
| 2022 | $2,681 | $115,700 | $16,400 | $99,300 |
| 2021 | $2,221 | $94,400 | $9,600 | $84,800 |
| 2020 | $2,290 | $97,000 | $9,600 | $87,400 |
| 2019 | $2,011 | $91,900 | $9,600 | $82,300 |
| 2018 | $2,189 | $86,300 | $9,600 | $76,700 |
| 2017 | $1,852 | $82,800 | $9,300 | $73,500 |
| 2016 | $1,855 | $83,000 | $9,300 | $73,700 |
| 2014 | $1,909 | $85,700 | $9,300 | $76,400 |
Source: Public Records
Map
Nearby Homes
- 212 S Beatty St
- 52 N Hinman St
- 1521 Indiana Ave
- 2032 Indiana Ave
- 213 Hege Ave
- 1631 Kentucky Ave
- 342 Jones St
- 2041 Mckinley Ave
- 2263 Wallace Ave
- 41 N Cherry St
- 620 Hutchins Ave
- 2651 Clifty St
- 507 N Cherry St
- 41 N Ross St
- 606 California St
- 661 Smith St
- 851 Werner Ave
- 809 Hutchins Ave
- 813 Cottage Ave
- 758 N Cherry St