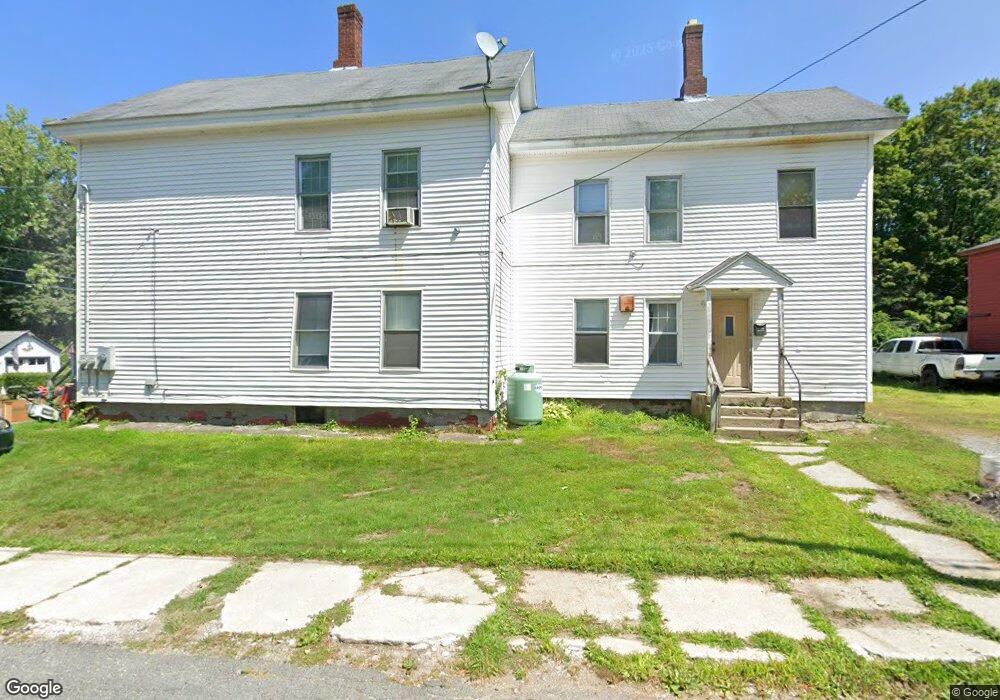
32 King St Orange, MA 01364
Estimated Value: $259,000 - $362,000
6
Beds
2
Baths
2,418
Sq Ft
$120/Sq Ft
Est. Value
About This Home
This home is located at 32 King St, Orange, MA 01364 and is currently estimated at $291,190, approximately $120 per square foot. 32 King St is a home located in Franklin County with nearby schools including Fisher Hill and Ralph C Mahar Regional School.
Ownership History
Date
Name
Owned For
Owner Type
Purchase Details
Closed on
Apr 14, 1999
Sold by
Wheeler Scott E
Bought by
Athol Clinton Coop Bk
Current Estimated Value
Purchase Details
Closed on
Dec 9, 1991
Sold by
Kenney James T
Bought by
Wheeler Scott E and Wheeler Paula J
Home Financials for this Owner
Home Financials are based on the most recent Mortgage that was taken out on this home.
Original Mortgage
$65,000
Interest Rate
8.64%
Create a Home Valuation Report for This Property
The Home Valuation Report is an in-depth analysis detailing your home's value as well as a comparison with similar homes in the area
Home Values in the Area
Average Home Value in this Area
Purchase History
| Date | Buyer | Sale Price | Title Company |
|---|---|---|---|
| Athol Clinton Coop Bk | $70,000 | -- | |
| Wheeler Scott E | $30,000 | -- |
Source: Public Records
Mortgage History
| Date | Status | Borrower | Loan Amount |
|---|---|---|---|
| Previous Owner | Wheeler Scott E | $65,000 | |
| Previous Owner | Wheeler Scott E | $29,000 |
Source: Public Records
Tax History
| Year | Tax Paid | Tax Assessment Tax Assessment Total Assessment is a certain percentage of the fair market value that is determined by local assessors to be the total taxable value of land and additions on the property. | Land | Improvement |
|---|---|---|---|---|
| 2025 | $35 | $210,200 | $22,000 | $188,200 |
| 2024 | $3,246 | $186,100 | $22,000 | $164,100 |
| 2023 | $3,220 | $179,300 | $19,800 | $159,500 |
| 2022 | $2,964 | $155,000 | $19,800 | $135,200 |
| 2021 | $74 | $121,400 | $41,500 | $79,900 |
| 2020 | $2,090 | $102,800 | $37,900 | $64,900 |
| 2019 | $2,031 | $90,200 | $32,800 | $57,400 |
| 2018 | $2,014 | $91,800 | $30,600 | $61,200 |
| 2017 | $1,949 | $91,800 | $30,600 | $61,200 |
| 2016 | $1,751 | $80,700 | $27,300 | $53,400 |
| 2015 | $1,722 | $82,900 | $29,100 | $53,800 |
| 2014 | $1,950 | $98,800 | $29,100 | $69,700 |
Source: Public Records
Map
Nearby Homes
Your Personal Tour Guide
Ask me questions while you tour the home.