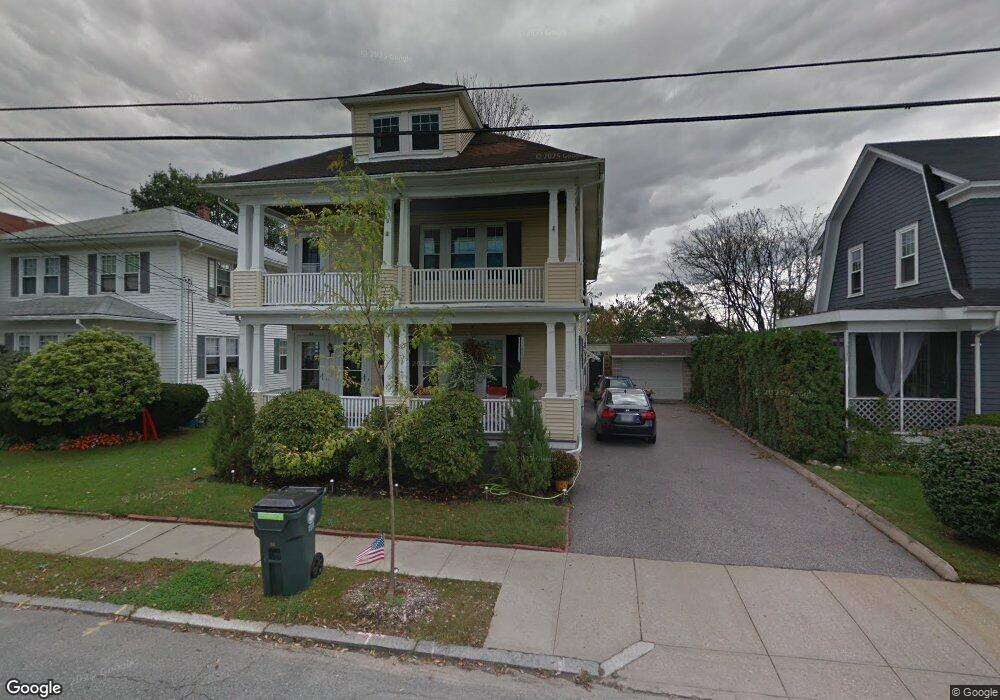
32 Lennon St Providence, RI 02908
Mount Pleasant NeighborhoodEstimated Value: $512,206 - $672,000
4
Beds
2
Baths
2,288
Sq Ft
$257/Sq Ft
Est. Value
About This Home
This home is located at 32 Lennon St, Providence, RI 02908 and is currently estimated at $587,052, approximately $256 per square foot. 32 Lennon St is a home located in Providence County with nearby schools including Charles N. Fortes Elementary School, Asa Messer Elementary School, and Veazie Street Elementary School.
Ownership History
Date
Name
Owned For
Owner Type
Purchase Details
Closed on
Jul 26, 2017
Sold by
Andolfo A Augustine A and Andolfo Nancy A
Bought by
Nguyen Anh N and Scampoli John A
Current Estimated Value
Home Financials for this Owner
Home Financials are based on the most recent Mortgage that was taken out on this home.
Original Mortgage
$245,373
Outstanding Balance
$203,975
Interest Rate
3.91%
Mortgage Type
FHA
Estimated Equity
$383,077
Create a Home Valuation Report for This Property
The Home Valuation Report is an in-depth analysis detailing your home's value as well as a comparison with similar homes in the area
Home Values in the Area
Average Home Value in this Area
Purchase History
| Date | Buyer | Sale Price | Title Company |
|---|---|---|---|
| Nguyen Anh N | $249,900 | -- |
Source: Public Records
Mortgage History
| Date | Status | Borrower | Loan Amount |
|---|---|---|---|
| Open | Nguyen Anh N | $245,373 |
Source: Public Records
Tax History Compared to Growth
Tax History
| Year | Tax Paid | Tax Assessment Tax Assessment Total Assessment is a certain percentage of the fair market value that is determined by local assessors to be the total taxable value of land and additions on the property. | Land | Improvement |
|---|---|---|---|---|
| 2025 | $3,931 | $520,700 | $160,000 | $360,700 |
| 2024 | $6,703 | $365,300 | $104,000 | $261,300 |
| 2023 | $6,703 | $365,300 | $104,000 | $261,300 |
| 2022 | $6,502 | $365,300 | $104,000 | $261,300 |
| 2021 | $5,966 | $242,900 | $79,300 | $163,600 |
| 2020 | $5,966 | $242,900 | $79,300 | $163,600 |
| 2019 | $5,966 | $242,900 | $79,300 | $163,600 |
| 2018 | $5,865 | $183,500 | $63,800 | $119,700 |
| 2017 | $5,865 | $183,500 | $63,800 | $119,700 |
| 2016 | $5,865 | $183,500 | $63,800 | $119,700 |
| 2015 | $5,087 | $153,700 | $63,800 | $89,900 |
| 2014 | $5,187 | $153,700 | $63,800 | $89,900 |
| 2013 | $5,187 | $153,700 | $63,800 | $89,900 |
Source: Public Records
Map
Nearby Homes