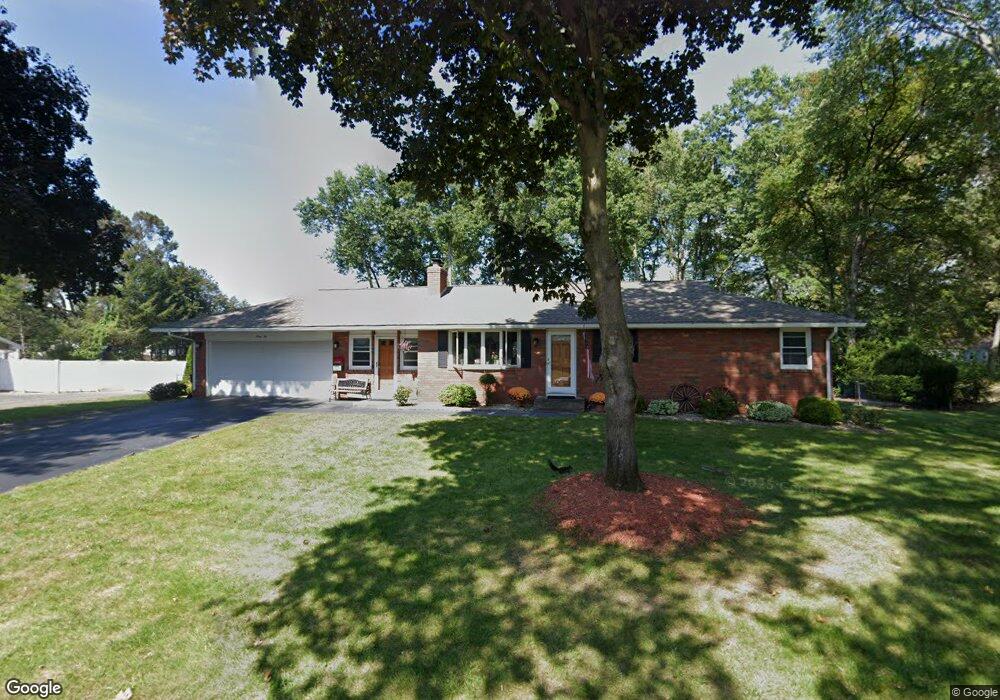
32 Michael Dr South Hadley, MA 01075
Estimated Value: $397,000 - $498,081
2
Beds
2
Baths
1,532
Sq Ft
$298/Sq Ft
Est. Value
About This Home
This home is located at 32 Michael Dr, South Hadley, MA 01075 and is currently estimated at $455,770, approximately $297 per square foot. 32 Michael Dr is a home located in Hampshire County with nearby schools including Plains Elementary School, Mosier Elementary School, and Michael E. Smith Middle School.
Ownership History
Date
Name
Owned For
Owner Type
Purchase Details
Closed on
May 23, 2007
Sold by
Lolli Linda E and Bernadis Alan J
Bought by
Henriques Jeffrey and Rodrigues Nichole
Current Estimated Value
Home Financials for this Owner
Home Financials are based on the most recent Mortgage that was taken out on this home.
Original Mortgage
$240,000
Outstanding Balance
$146,780
Interest Rate
6.27%
Mortgage Type
Purchase Money Mortgage
Estimated Equity
$308,990
Create a Home Valuation Report for This Property
The Home Valuation Report is an in-depth analysis detailing your home's value as well as a comparison with similar homes in the area
Home Values in the Area
Average Home Value in this Area
Purchase History
| Date | Buyer | Sale Price | Title Company |
|---|---|---|---|
| Henriques Jeffrey | $240,000 | -- |
Source: Public Records
Mortgage History
| Date | Status | Borrower | Loan Amount |
|---|---|---|---|
| Open | Henriques Jeffrey | $240,000 |
Source: Public Records
Tax History Compared to Growth
Tax History
| Year | Tax Paid | Tax Assessment Tax Assessment Total Assessment is a certain percentage of the fair market value that is determined by local assessors to be the total taxable value of land and additions on the property. | Land | Improvement |
|---|---|---|---|---|
| 2025 | $7,538 | $473,200 | $142,000 | $331,200 |
| 2024 | $7,537 | $452,700 | $132,400 | $320,300 |
| 2023 | $6,983 | $397,900 | $120,600 | $277,300 |
| 2022 | $6,625 | $358,500 | $120,600 | $237,900 |
| 2021 | $6,519 | $335,000 | $112,400 | $222,600 |
| 2020 | $6,367 | $319,300 | $112,400 | $206,900 |
| 2019 | $6,023 | $298,900 | $107,100 | $191,800 |
| 2018 | $5,802 | $291,100 | $104,300 | $186,800 |
| 2017 | $5,583 | $277,500 | $104,300 | $173,200 |
| 2016 | $4,657 | $234,600 | $95,000 | $139,600 |
| 2015 | $4,413 | $227,700 | $92,100 | $135,600 |
Source: Public Records
Map
Nearby Homes