Estimated Value: $298,409 - $364,000
3
Beds
3
Baths
1,976
Sq Ft
$166/Sq Ft
Est. Value
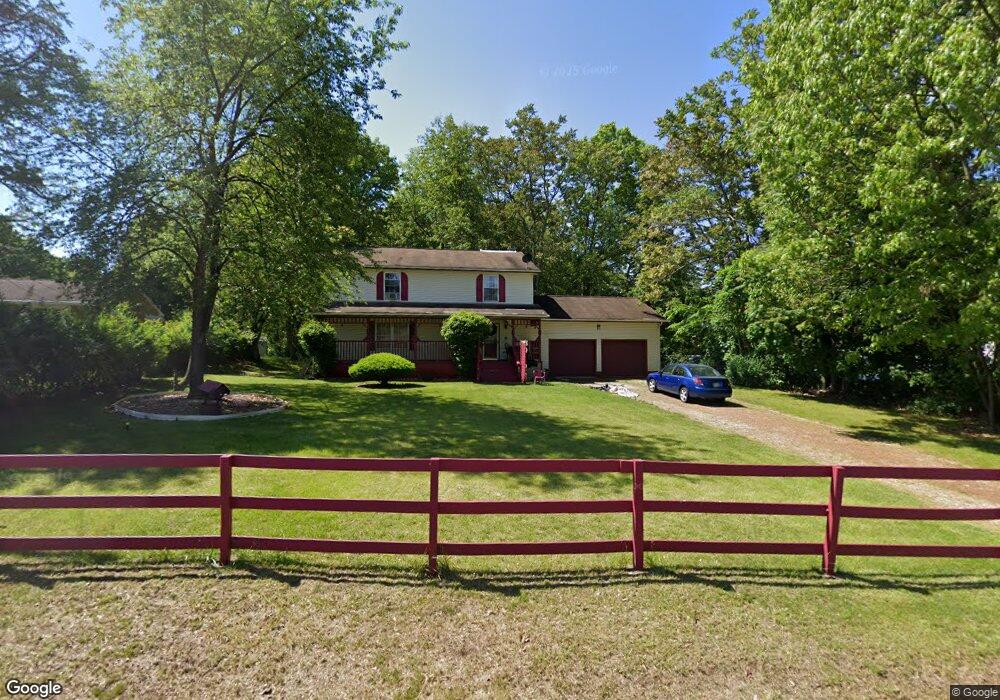
About This Home
This home is located at 32 Moore Rd, Akron, OH 44319 and is currently estimated at $327,352, approximately $165 per square foot. 32 Moore Rd is a home located in Summit County with nearby schools including Greenwood Elementary School, Green Intermediate Elementary School, and Green Primary School.
Ownership History
Date
Name
Owned For
Owner Type
Purchase Details
Closed on
May 11, 2023
Sold by
Marchese John J
Bought by
Marchese Frank J
Current Estimated Value
Purchase Details
Closed on
May 10, 2023
Sold by
Marchese John J
Bought by
Marchese Frank J
Purchase Details
Closed on
May 7, 2010
Sold by
Marchese Frank J
Bought by
Marchese John J
Purchase Details
Closed on
Nov 17, 1999
Sold by
Schubert Michael R and Schubert Kelly J
Bought by
Marchese Frank J
Create a Home Valuation Report for This Property
The Home Valuation Report is an in-depth analysis detailing your home's value as well as a comparison with similar homes in the area
Purchase History
| Date | Buyer | Sale Price | Title Company |
|---|---|---|---|
| Marchese Frank J | -- | None Listed On Document | |
| Marchese Frank J | -- | None Listed On Document | |
| Marchese John J | $157,780 | None Available | |
| Marchese Frank J | $24,000 | Midland Commerce Group |
Source: Public Records
Tax History
| Year | Tax Paid | Tax Assessment Tax Assessment Total Assessment is a certain percentage of the fair market value that is determined by local assessors to be the total taxable value of land and additions on the property. | Land | Improvement |
|---|---|---|---|---|
| 2025 | $4,737 | $74,200 | $12,551 | $61,649 |
| 2024 | $4,719 | $97,790 | $12,551 | $85,239 |
| 2023 | $4,737 | $97,790 | $12,551 | $85,239 |
| 2022 | $3,050 | $56,701 | $9,510 | $47,191 |
| 2021 | $2,866 | $56,701 | $9,510 | $47,191 |
| 2020 | $3,711 | $74,530 | $9,510 | $65,020 |
| 2019 | $2,702 | $51,080 | $9,510 | $41,570 |
| 2018 | $2,764 | $51,080 | $9,510 | $41,570 |
| 2017 | $2,972 | $51,080 | $9,510 | $41,570 |
| 2016 | $2,930 | $51,080 | $9,510 | $41,570 |
| 2015 | $2,972 | $51,080 | $9,510 | $41,570 |
| 2014 | $2,953 | $51,080 | $9,510 | $41,570 |
| 2013 | $2,870 | $49,350 | $9,510 | $39,840 |
Source: Public Records
Map
Nearby Homes
- 3785 S Main St
- 68 Starboard Cir
- 221 Lake Front Dr
- 277 Lake Front Dr
- 76 Forest Mill Ln
- 3809 N Glenridge Rd
- 3812 N Glenridge Rd
- 222 Olden Ave
- 397 Wonder Lake Dr
- 265 E Pace Ave
- 308 E Vista Ave
- 4298 S Main St Unit 4302
- 4135 State Park Dr
- 347 Dorwil Dr
- 3273 S Jasmine Ave
- 4387 Point Comfort Dr
- 556 Kruger Ave
- 619 Moore Rd
- 570 E Turkeyfoot Lake Rd
- 253 Aqua Blvd
Your Personal Tour Guide
Ask me questions while you tour the home.