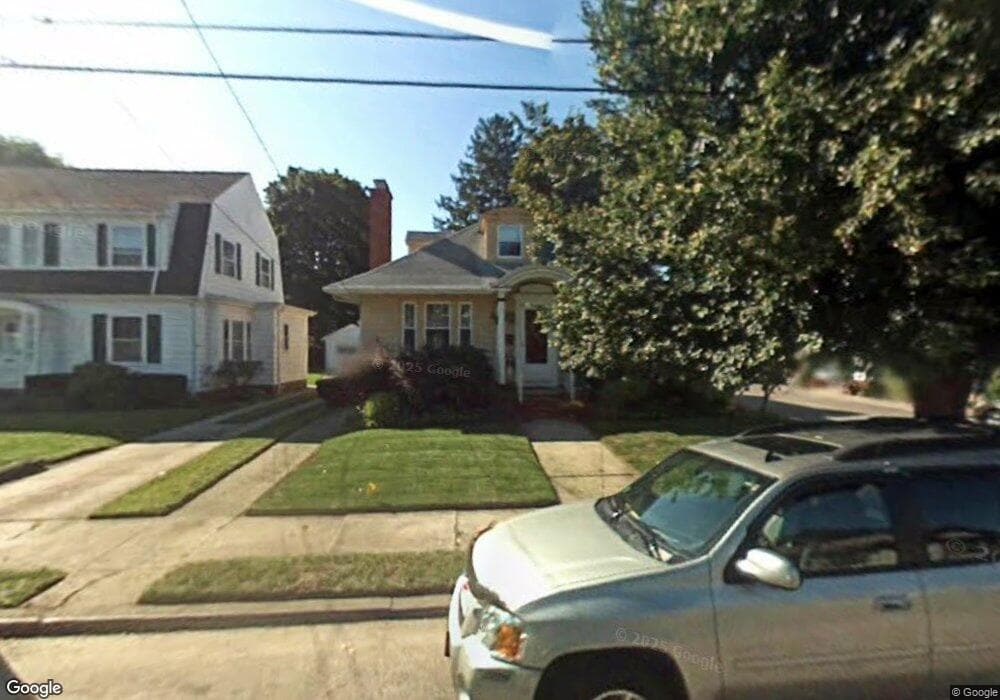
32 Moorland Ave Cranston, RI 02905
Edgewood NeighborhoodEstimated Value: $465,816 - $626,000
4
Beds
2
Baths
1,728
Sq Ft
$321/Sq Ft
Est. Value
About This Home
This home is located at 32 Moorland Ave, Cranston, RI 02905 and is currently estimated at $554,204, approximately $320 per square foot. 32 Moorland Ave is a home located in Providence County with nearby schools including Edward S. Rhodes School, Park View Middle School, and Cranston High School East.
Ownership History
Date
Name
Owned For
Owner Type
Purchase Details
Closed on
Mar 1, 1995
Sold by
Long Gerald E
Bought by
Squillante Richard O and Squillante Madeline
Current Estimated Value
Purchase Details
Closed on
Aug 12, 1994
Sold by
Perrotti John J and Perrotti Bonnie
Bought by
Long Gerald E
Purchase Details
Closed on
May 16, 1994
Sold by
Strike David G and Strike Joan
Bought by
Perrotti John J and Perrotti Bonnie
Create a Home Valuation Report for This Property
The Home Valuation Report is an in-depth analysis detailing your home's value as well as a comparison with similar homes in the area
Home Values in the Area
Average Home Value in this Area
Purchase History
| Date | Buyer | Sale Price | Title Company |
|---|---|---|---|
| Squillante Richard O | $120,000 | -- | |
| Long Gerald E | $100,000 | -- | |
| Perrotti John J | $65,000 | -- |
Source: Public Records
Mortgage History
| Date | Status | Borrower | Loan Amount |
|---|---|---|---|
| Open | Perrotti John J | $60,000 | |
| Closed | Perrotti John J | $116,000 | |
| Closed | Perrotti John J | $54,000 |
Source: Public Records
Tax History Compared to Growth
Tax History
| Year | Tax Paid | Tax Assessment Tax Assessment Total Assessment is a certain percentage of the fair market value that is determined by local assessors to be the total taxable value of land and additions on the property. | Land | Improvement |
|---|---|---|---|---|
| 2025 | $5,075 | $365,600 | $102,000 | $263,600 |
| 2024 | $4,976 | $365,600 | $102,000 | $263,600 |
| 2023 | $4,795 | $253,700 | $70,400 | $183,300 |
| 2022 | $4,696 | $253,700 | $70,400 | $183,300 |
| 2021 | $4,567 | $253,700 | $70,400 | $183,300 |
| 2020 | $4,517 | $217,500 | $73,700 | $143,800 |
| 2019 | $4,517 | $217,500 | $73,700 | $143,800 |
| 2018 | $4,413 | $217,500 | $73,700 | $143,800 |
| 2017 | $3,902 | $170,100 | $67,000 | $103,100 |
| 2016 | $3,819 | $170,100 | $67,000 | $103,100 |
| 2015 | $3,819 | $170,100 | $67,000 | $103,100 |
| 2014 | $2,824 | $162,800 | $67,000 | $95,800 |
Source: Public Records
Map
Nearby Homes
- 14 Park Ave
- 10 Sylvan Ave
- 28 Sylvan Ave
- 19 Warwick Ave
- 177 Arnold Ave
- 98 Columbia Ave
- 27 Cliffdale Ave
- 171 Norwood Ave
- 112 Villa Ave
- 51 Columbia Ave
- 114 Norwood Ave
- 42 Netherlands Ave
- 68 Cliffdale Ave
- 1291 Narragansett Blvd Unit 4
- 234 Park Ave
- 12 Harbour Terrace
- 15 Wheeler Ave
- 88 Wentworth Ave
- 22 Community Dr
- 303 Narragansett St