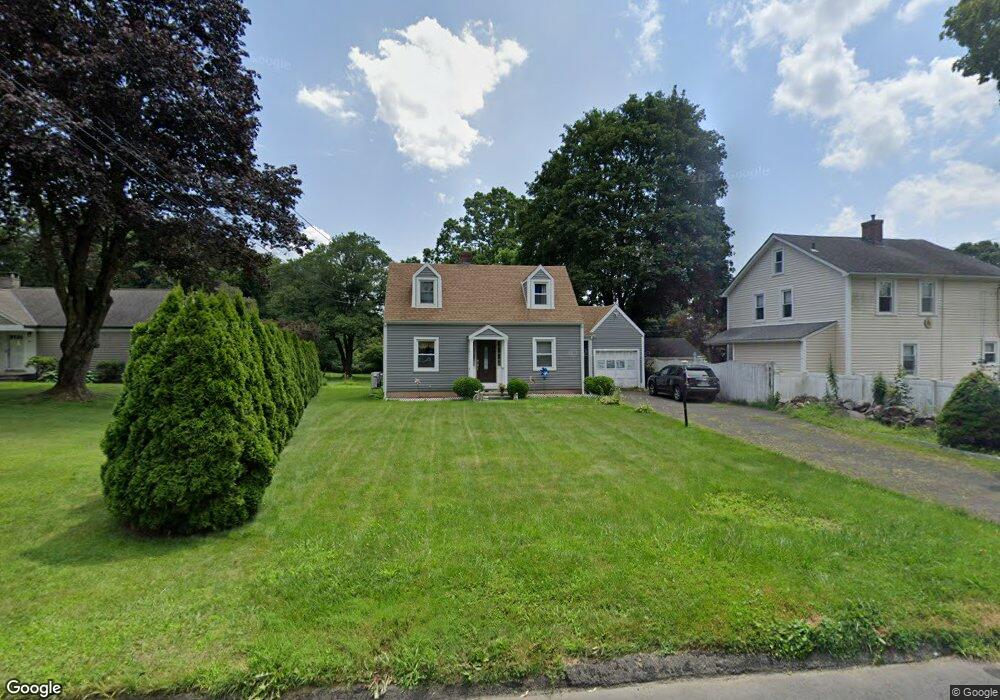
32 Myrtle Ave Danbury, CT 06810
Estimated Value: $395,000 - $476,000
2
Beds
3
Baths
990
Sq Ft
$432/Sq Ft
Est. Value
About This Home
This home is located at 32 Myrtle Ave, Danbury, CT 06810 and is currently estimated at $427,193, approximately $431 per square foot. 32 Myrtle Ave is a home located in Fairfield County with nearby schools including Mill Ridge Primary School, Rogers Park Middle School, and Danbury High School.
Ownership History
Date
Name
Owned For
Owner Type
Purchase Details
Closed on
Nov 12, 2003
Sold by
Saules 2Nd Joao and Saules Carine
Bought by
Coelho Lea
Current Estimated Value
Home Financials for this Owner
Home Financials are based on the most recent Mortgage that was taken out on this home.
Original Mortgage
$207,920
Interest Rate
7%
Purchase Details
Closed on
Jan 11, 2000
Sold by
Pankulis Pauline
Bought by
Saules Joao G and Saules Carine O
Home Financials for this Owner
Home Financials are based on the most recent Mortgage that was taken out on this home.
Original Mortgage
$158,180
Interest Rate
7.73%
Purchase Details
Closed on
Mar 1, 1999
Sold by
Marcone Luigi and Marcone Margaret A
Bought by
Pankulis Pauline
Purchase Details
Closed on
Aug 15, 1995
Sold by
Sincerbeaux John and Sincerbeaux Nancy
Bought by
Marcone Luigi and Gillard Margaret
Create a Home Valuation Report for This Property
The Home Valuation Report is an in-depth analysis detailing your home's value as well as a comparison with similar homes in the area
Home Values in the Area
Average Home Value in this Area
Purchase History
| Date | Buyer | Sale Price | Title Company |
|---|---|---|---|
| Coelho Lea | $259,900 | -- | |
| Saules Joao G | $159,500 | -- | |
| Pankulis Pauline | $145,000 | -- | |
| Marcone Luigi | $132,000 | -- |
Source: Public Records
Mortgage History
| Date | Status | Borrower | Loan Amount |
|---|---|---|---|
| Open | Marcone Luigi | $272,000 | |
| Closed | Marcone Luigi | $207,920 | |
| Previous Owner | Marcone Luigi | $156,817 | |
| Previous Owner | Marcone Luigi | $158,180 |
Source: Public Records
Tax History
| Year | Tax Paid | Tax Assessment Tax Assessment Total Assessment is a certain percentage of the fair market value that is determined by local assessors to be the total taxable value of land and additions on the property. | Land | Improvement |
|---|---|---|---|---|
| 2025 | $4,576 | $183,120 | $61,460 | $121,660 |
| 2024 | $4,475 | $183,120 | $61,460 | $121,660 |
| 2023 | $4,272 | $183,120 | $61,460 | $121,660 |
| 2022 | $3,827 | $135,600 | $64,700 | $70,900 |
| 2021 | $3,743 | $135,600 | $64,700 | $70,900 |
| 2020 | $3,743 | $135,600 | $64,700 | $70,900 |
| 2019 | $3,743 | $135,600 | $64,700 | $70,900 |
| 2018 | $3,743 | $135,600 | $64,700 | $70,900 |
| 2017 | $3,680 | $127,100 | $61,600 | $65,500 |
| 2016 | $3,645 | $127,100 | $61,600 | $65,500 |
| 2015 | $3,592 | $127,100 | $61,600 | $65,500 |
| 2014 | $3,508 | $127,100 | $61,600 | $65,500 |
Source: Public Records
Map
Nearby Homes
- 70 Westville Ave
- 67 B Westville Ave
- 17 Staples St
- 10 Scuppo Rd Unit A13
- 12 Scuppo Rd Unit D4
- 22 Irving Place
- 18 Grandview Ave
- 59 Pleasant St
- 57 Pleasant St
- 51 Park Ave Unit 6-32
- 26 Crescent Dr
- 34 Mallory St
- 81 Park Ave Unit 2008
- 23 Scuppo Rd Unit 5-7
- 8 Ann Dr Unit B
- 1 Wilderswood Way
- 23 Franklin St Unit 1
- 22 Robinson Ave
- 26 Walden Ct Unit Lot 6
- 11 Wooster Heights
Your Personal Tour Guide
Ask me questions while you tour the home.