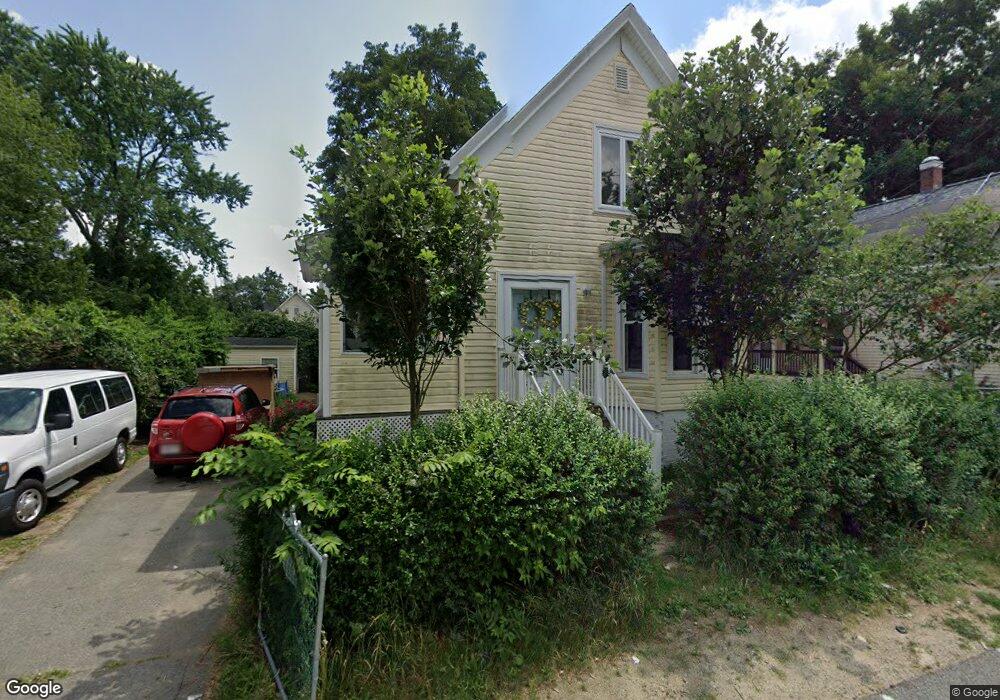
32 Myrtle St Brockton, MA 02301
Clifton Heights NeighborhoodEstimated Value: $425,000 - $457,000
3
Beds
1
Bath
996
Sq Ft
$445/Sq Ft
Est. Value
About This Home
This home is located at 32 Myrtle St, Brockton, MA 02301 and is currently estimated at $442,831, approximately $444 per square foot. 32 Myrtle St is a home located in Plymouth County with nearby schools including Gilmore Elementary School, John F. Kennedy Elementary School, and Davis K-8 School.
Ownership History
Date
Name
Owned For
Owner Type
Purchase Details
Closed on
Nov 20, 2013
Sold by
Eustace Patrick M and Eustace Leslie A
Bought by
Eustace Leslie A and Eustace Anne M
Current Estimated Value
Home Financials for this Owner
Home Financials are based on the most recent Mortgage that was taken out on this home.
Original Mortgage
$121,558
Outstanding Balance
$89,611
Interest Rate
4.25%
Mortgage Type
New Conventional
Estimated Equity
$353,220
Create a Home Valuation Report for This Property
The Home Valuation Report is an in-depth analysis detailing your home's value as well as a comparison with similar homes in the area
Home Values in the Area
Average Home Value in this Area
Purchase History
| Date | Buyer | Sale Price | Title Company |
|---|---|---|---|
| Eustace Leslie A | $119,000 | -- |
Source: Public Records
Mortgage History
| Date | Status | Borrower | Loan Amount |
|---|---|---|---|
| Open | Eustace Leslie A | $121,558 |
Source: Public Records
Tax History
| Year | Tax Paid | Tax Assessment Tax Assessment Total Assessment is a certain percentage of the fair market value that is determined by local assessors to be the total taxable value of land and additions on the property. | Land | Improvement |
|---|---|---|---|---|
| 2025 | $4,804 | $396,700 | $135,700 | $261,000 |
| 2024 | $4,602 | $382,900 | $135,700 | $247,200 |
| 2023 | $4,307 | $331,800 | $101,700 | $230,100 |
| 2022 | $4,162 | $297,900 | $92,200 | $205,700 |
| 2021 | $3,667 | $252,900 | $76,200 | $176,700 |
| 2020 | $3,575 | $236,000 | $71,900 | $164,100 |
| 2019 | $3,347 | $215,400 | $69,400 | $146,000 |
| 2018 | $3,384 | $210,700 | $69,400 | $141,300 |
| 2017 | $2,958 | $183,700 | $69,400 | $114,300 |
| 2016 | $3,168 | $182,500 | $67,200 | $115,300 |
| 2015 | $2,799 | $154,200 | $67,200 | $87,000 |
| 2014 | $2,736 | $150,900 | $67,200 | $83,700 |
Source: Public Records
Map
Nearby Homes
Your Personal Tour Guide
Ask me questions while you tour the home.